Command Line Chart Generator
SqlChart allows generating charts from database data using only the command line. It works with a large number of databases, allows configuration of chart type/height/width and is intended for use within scripts, allowing easy generation of charts for inclusion within emailed reports etc.
SqlChart is based on the charting engine from QStudio therefore the chart types and data formats supported are the same.
Example SQL Charts
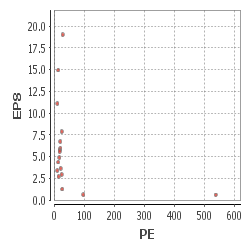
	C:\Program Files (x86)\TimeStored.com\>sqlchart -D mem:db1 -P 8000 -servertype h2 -host localhost -e "select sym,eps,pe,10 from stock" -o mc-sql-bu
	bblechart.png --chart bubblechart --height 250 --width 250


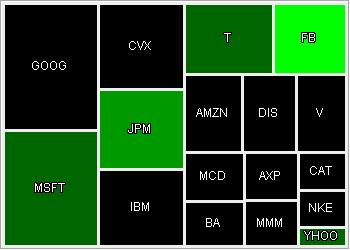
>sqlchart -D mem:db1 -P 8000 -servertype h2 -host localhost -e "select sym,name,marketcap,volume from stock"
	-o mc-sql-heatmap.png --chart heatmap --height 250 --width 350


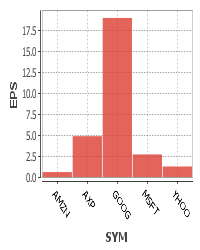
>sqlchart -D mem:db1 -P 8000 -servertype h2 -host localhost -e "select sym,eps from stock where sym in ('AMZN
	','AXP','GOOG','MSFT','YHOO')" -o eps-sql-barchart.png --height 250 --width 200
Download
SqlChart is included as part of the QStudio download.
- If you installed the windows version, you will find a sqlchart.bat file within the
C:\Program Files (x86)\TimeStored.com\directory. - If you downloaded the zip version, you will find a sqlchart.bat within the expanded files.
- If you downloaded the jar file only (for linux/mac) you will need to use the expanded command:
java -cp qstudio.jar com.timestored.sqldash.SqlChart ARGUMENTShowever be aware that this particular call may change.
Command Line options
Generate a chart using an inline sql call to a Microsoft SQL Server database
sqlchart --host dbserver --servertype mssql --user ryan --pass 123abc --chart barchart --execute "select * from tradetbl"
Generate a chart using a piped sql file call to a MySQL Server database, last statement in the file is the charts query.
sqlchart --host mysqlserver --servertype mysql --user ryan --pass 123abc --chart areachart < yourfile.sql
| Option (* = required) | Description |
|---|---|
-?, --help | Display a help message and exit. |
-D, --database <db_name> | The database to use. |
-H, --height <output_height> | Set the height of the chart output (default: 300) |
*-P, --port <port_num> | The TCP/IP port number to use for the SQL Server connection. |
-W, --width <output_width> | Set the width of the chart output (default: 400) |
-c, --chart <chart_type> | Set the selected chart type. Options available: timeseries, areachart, barchart, bubblechart, candlestick, datatable, heatmap, histogram, linechart, noredraw, piechart, scatterplot (default: barchart) |
-e, --execute <sql_statement> | Execute the selected sql statement. |
-h, --host <host_name> | SQL server host that will be queried. (default: localhost) |
-o, --out <file_name> | The name of the destination image file. (default: out.png) |
-p, --password <password> | Password used to connect to SQL server. |
*-s, --servertype <server_type> | The type of sql server being queried. Valid values include:kdb,mysql,postgres,mssql,h2. |
-u, --user <user_name> | Username used to connect to SQL server. |
Further Examples
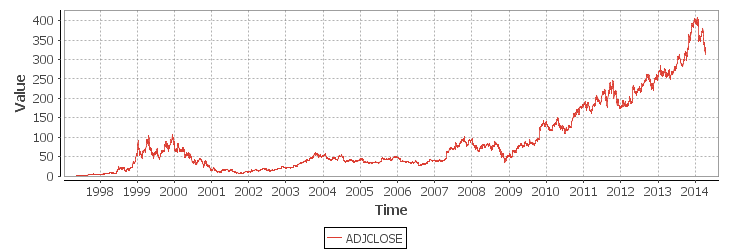
	>sqlchart -D mem:db1 -P 8000 -servertype h2 -host localhost -e "select
	 date,adjClose from ohlc where sym='AMZN'" -o c:/temp/amazon-chart.png --chart timeseries --height 250 --width 730

c:\temp\amazon-chart.png
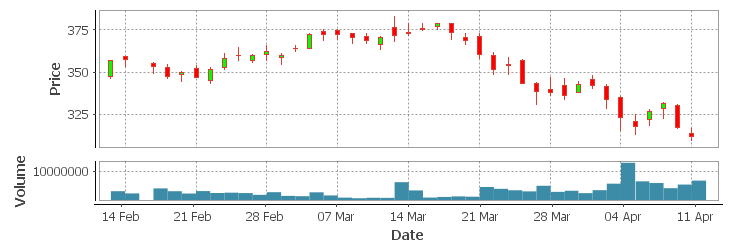
	>sqlchart -D mem:db1 -P 8000 -servertype h2 -host localhost -e "select * from ohlc where sym='AMZN'  AND (dat
	e > CURDATE()-60)" -o c:/temp/amazon-candlestick.png --chart candlestick --height 250 --width 730

c:\temp\amazon-candlestick.png
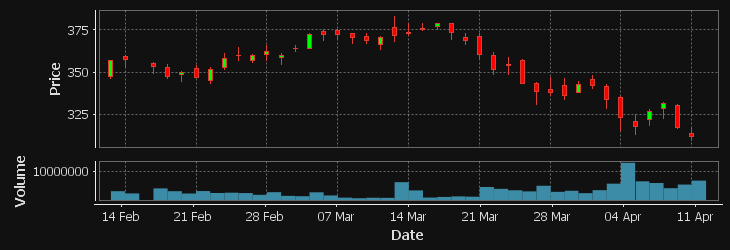
	>sqlchart -D mem:db1 -P 8000 -servertype h2 -host localhost -e "select * from ohlc where sym='AMZN'  AND (dat
	e > CURDATE()-60)" -o amazon-candlestick-dark.png --chart candlestick --height 250 --width 730 --theme dark

amazon-candlestick-dark.png
