Pulse - SQL Notebook
Pulse SQL Notebooks allow developers to write Markdown+SQL and to produce live HTML5 reports.
This page documents specifically how to get started using SQL Notebooks within Pulse. For the complete documentation and tutorials see our specific SQL Notebook Documentation and our SQL Notebook page.
Add SQL Notebook

At the top of the dashboard listing page, click Add Notebook. Note: you must have editor permissions.
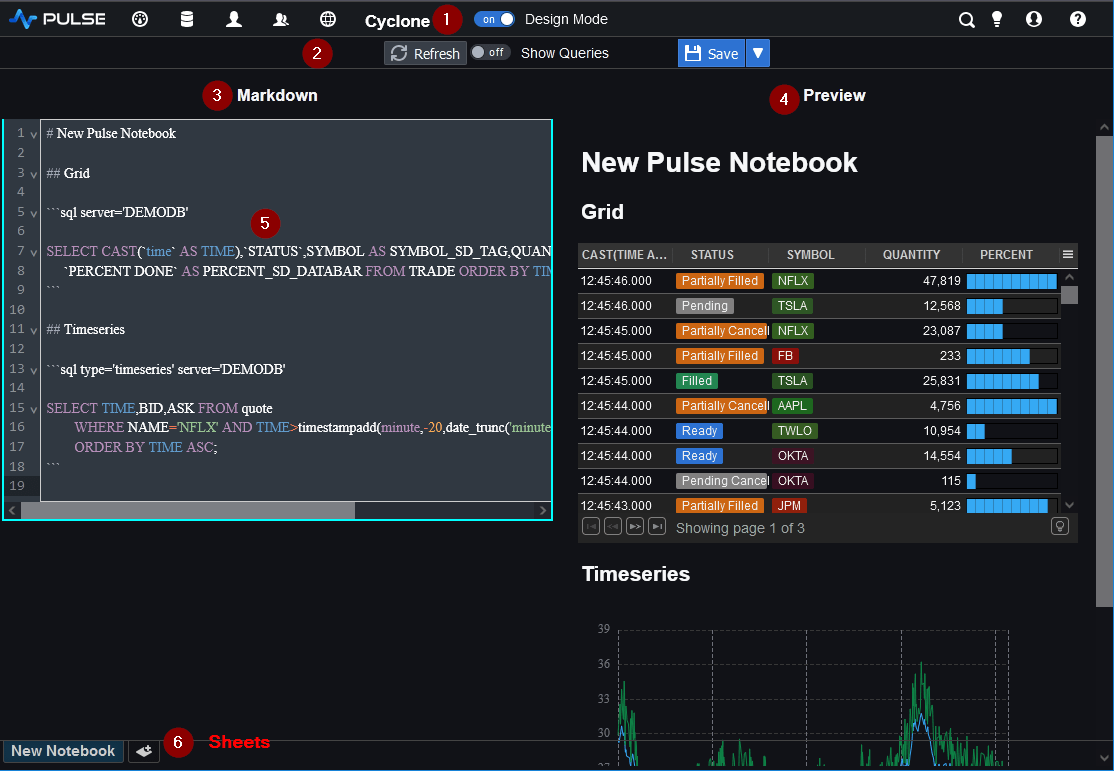
This will then open the new notebook with some example content in edit mode:
Control Layout
The general principle is that we edit the markdown on the left and the preview on the right gets updated automatically.

Design Mode- Toggles between the code editor and a presentation view.- Controls - Allow refreshing the data or showing which queries are being sent.
- Markdown - Is the code editor.
- Preview - Shows how the resulting notebook will look.
- The markdown + SQL code itself.
Sheets- Similar to excel, we can have multiple tabs, each will become a page within the markdown document.
Add Chart
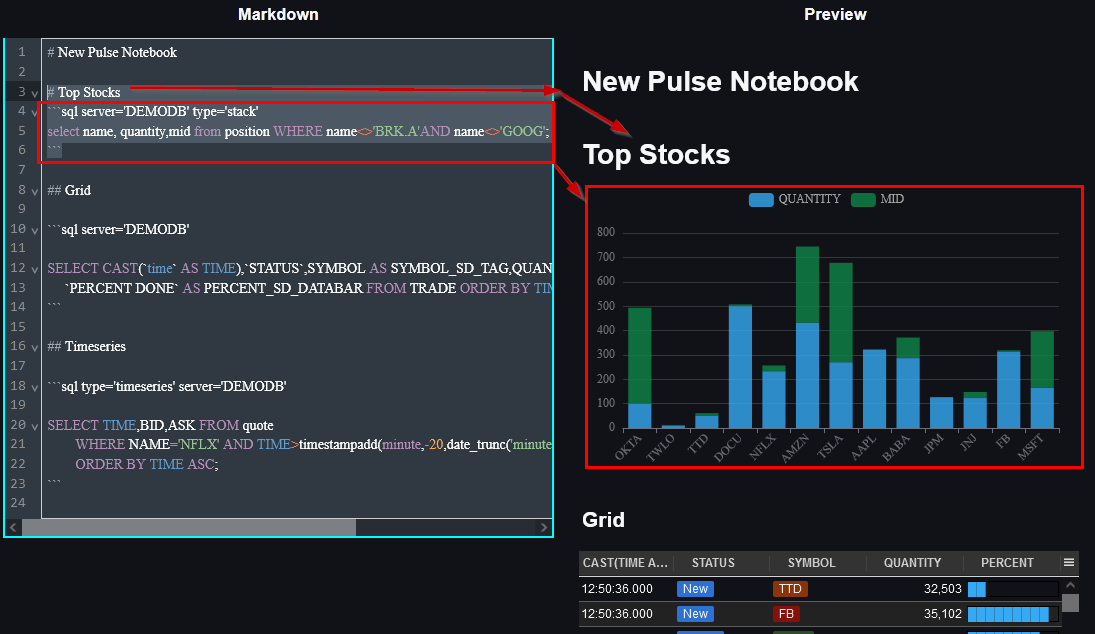
To add a chart, we create a new ```sql code block. For example, we could add:
Chart Options include: grid, timeseries, area, line, bar, stack, bar_horizontal, stack_horizontal, pie, scatter, bubble, candle, depthmap, radar, treemap, heatmap, calendar, boxplot, 3dsurface, 3dbar, sunburst, tree, metrics, sankey
The server must be set to a server name that exists within Pulse.
You can see that adding header markdown directly maps to a new header and adding the code block directly maps to adding the chart.

Add Page
To add a page, click on the [+] tab at the bottom left of the page.

Rename Page
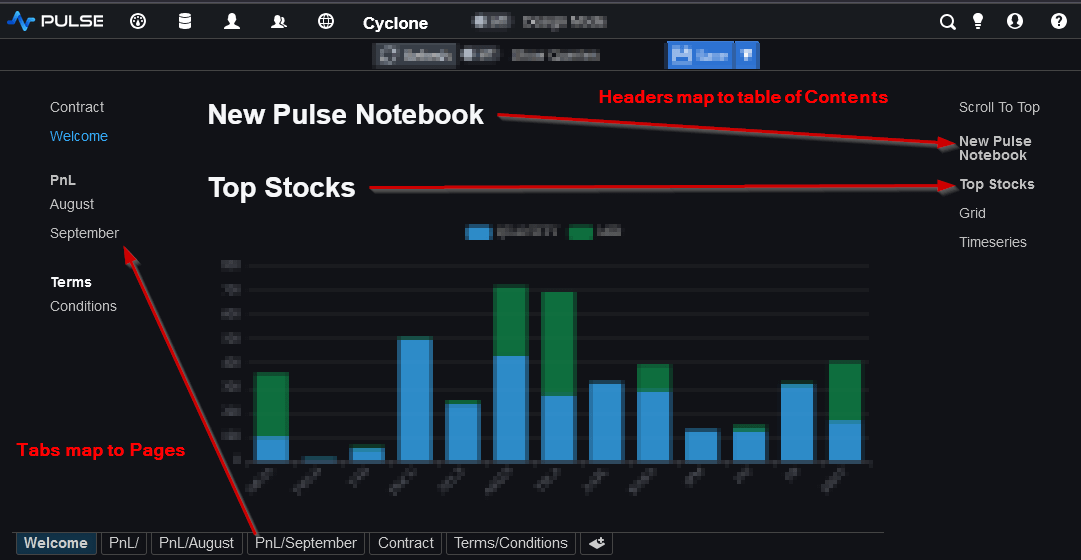
Intuitively, tabs map to pages and headers within a page map to the table of Contents on the right-hand side.
To rename a page Double-click on an existing name.
You can name pages with forward slashes in the name to create nested levels.

