Building a kdb+ Trade Blotter
Download Pulse
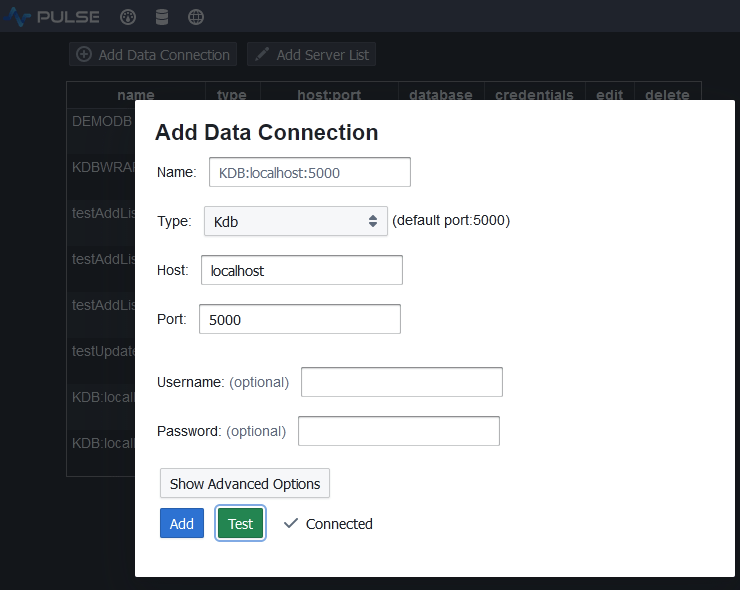
Add kdb+ Server Connection
To add a connection goto Connections->"Add Data Connection" and fill in your details.
You can try clicking test to see if the connection works before adding it.
Populating the Tables
Copy and Paste the below code into the SQL Editor and press "Send Query":
You can run "-10 sublist trade" to check the data is there:
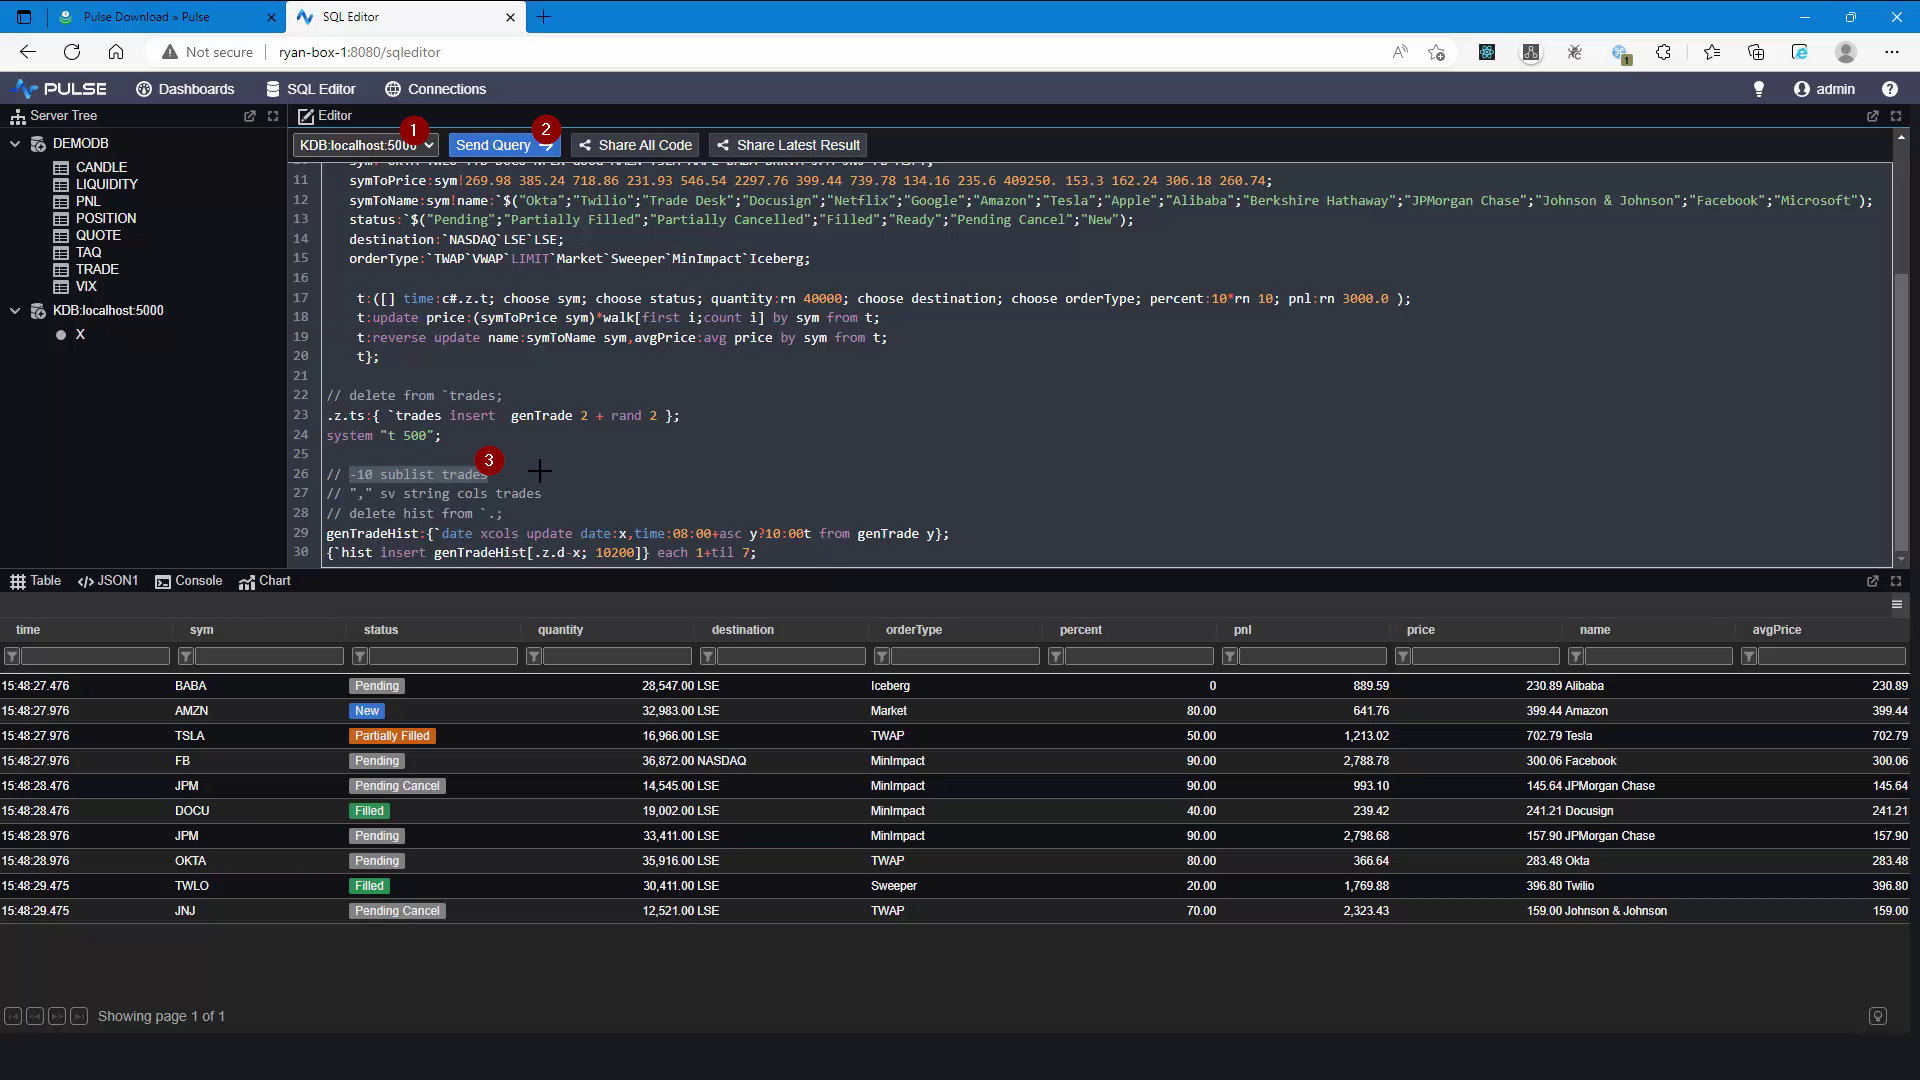
- Make sure your data source is selected
- Enter your SQL query, click save or highlight all text and press ctrl+E
- Highlight
-10 sublist tradesand press Ctrl+E to run only that code
Real-Time Trade Blotter
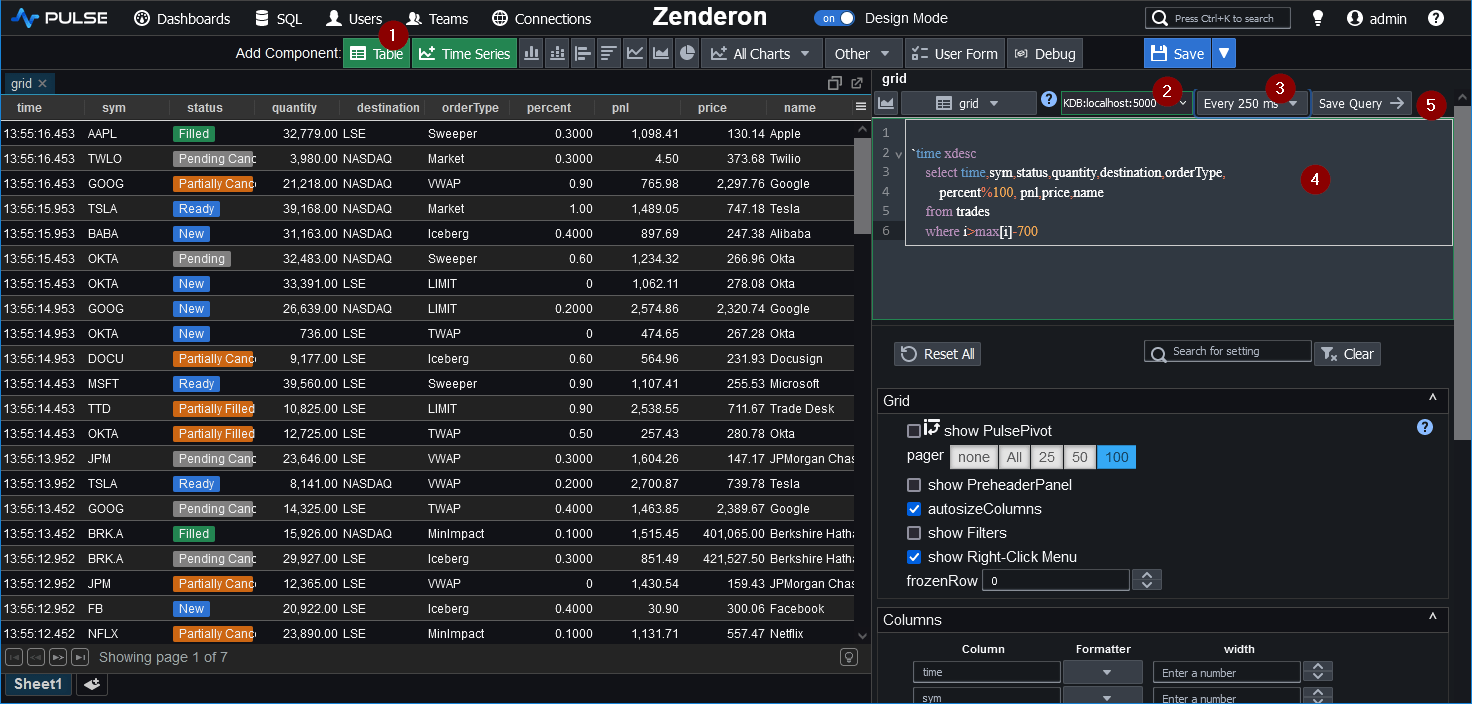
First make sure you are in design-mode else click the toggle at the top of the application. This should add a top panel that allows you to add components.
- Click
Tableto add that component - Make sure your kdb+ data source is selected
- Select the refresh rate.
Every 250ms - Enter your SQL query, click save or press ctrl+E
Customizing Table Appearance
Formatting Columns
Column formatters can be applied by either:
- Right-clicking on the tables column and selecing the formatter.
- Or on the right-hand side, select a formatter from the dropdown.
Here you can see TAG styling being applied to render the sym column with a unique colour per string and
the DATABAR styling used to represent the percentage as an inline bar chart.
For more information on styling tables see our table docs or for row specific highlighting see row formatting.
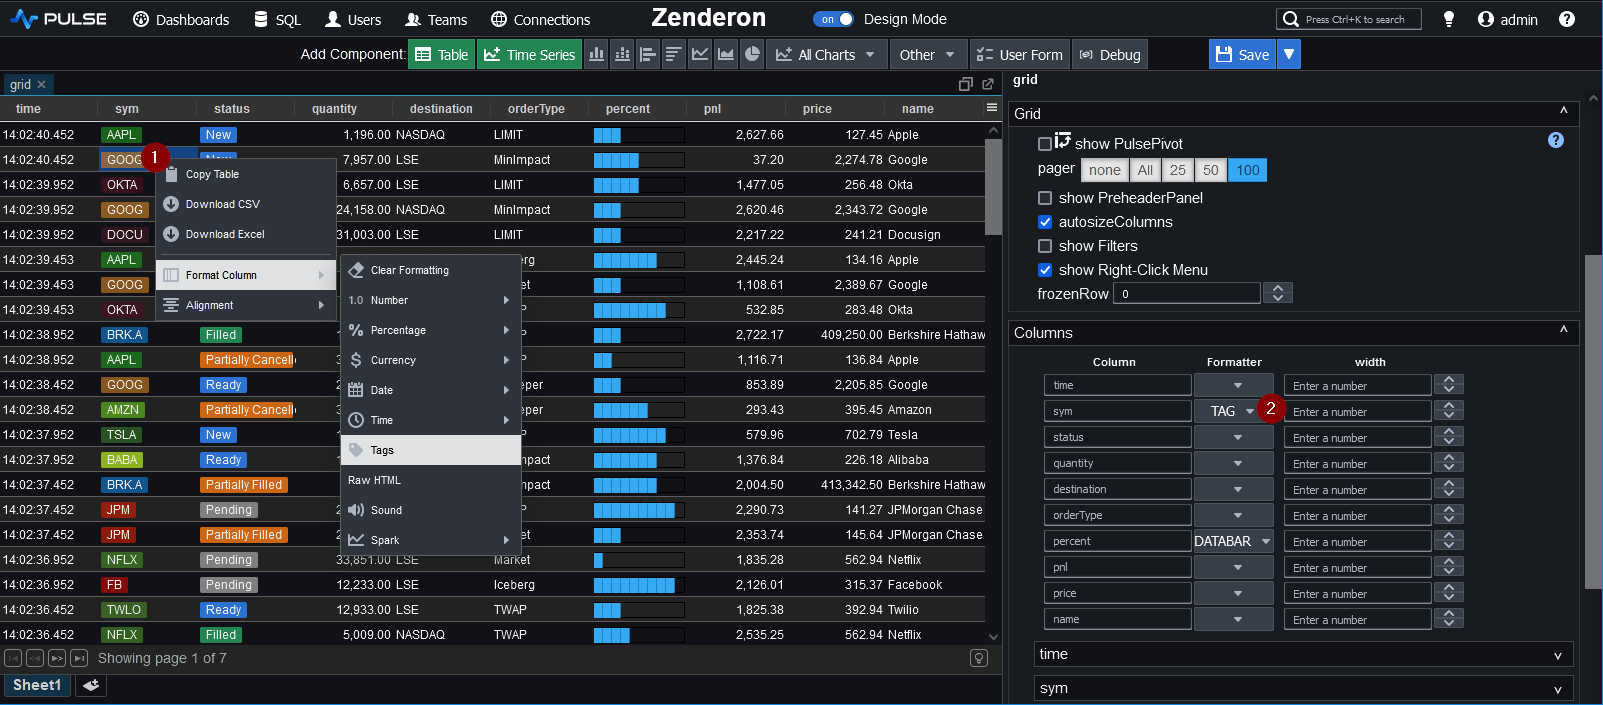
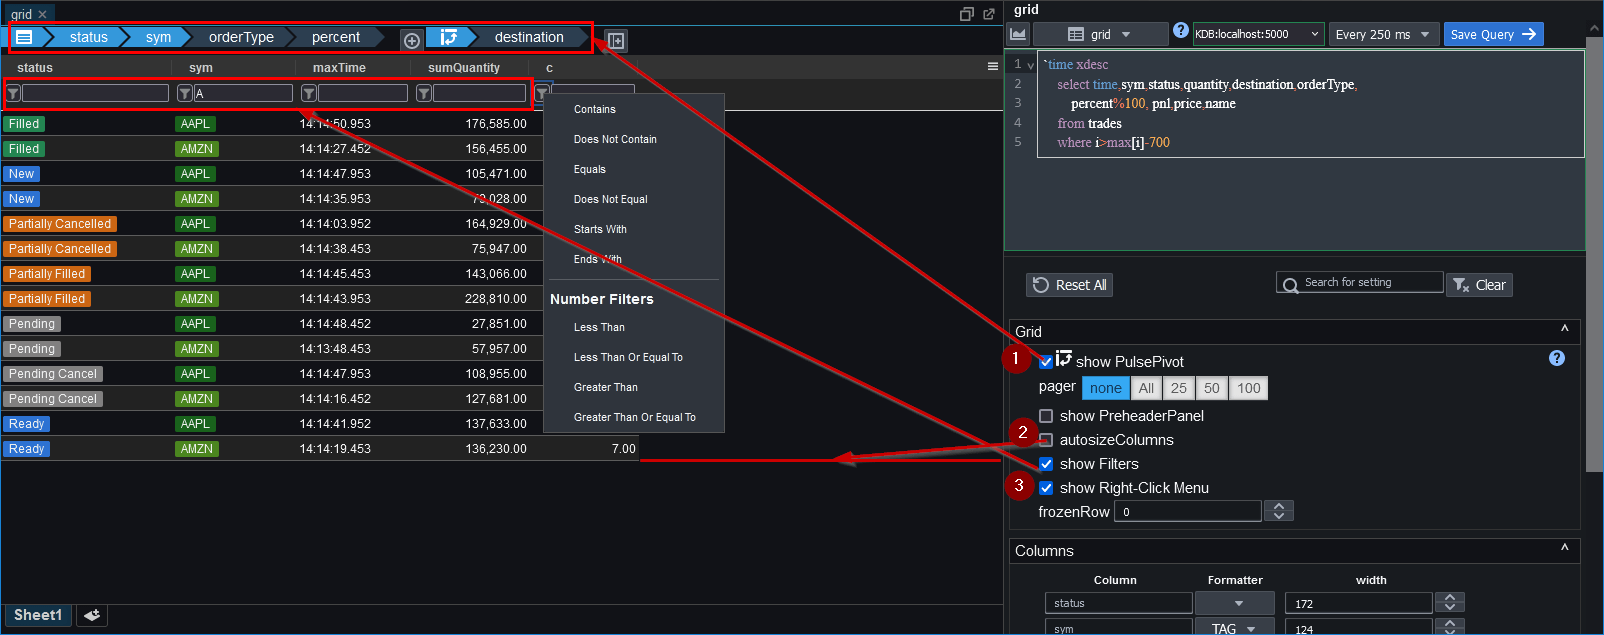
Table Configuration
The table can be customized to:
show Pulse Pivot- Which allows end users to perform group-bys and pivots using only the UI.autoSize columns- To toggle where columns spread to occupy 100% or try to fit the data.show Filters- Similar to excel, smart filters allow users to filter the rows displayed.
More information can be found in the Pivot documentation.
Next - Try it yourself
Thanks for watching our demo. Please download Pulse to give it a try for yourself.
