Can DuckDB do everything that a million dollar database can do?
Analyzing Stock Data with DuckDB: Loading and calculating VWAP & OHLC from NYSE TAQ
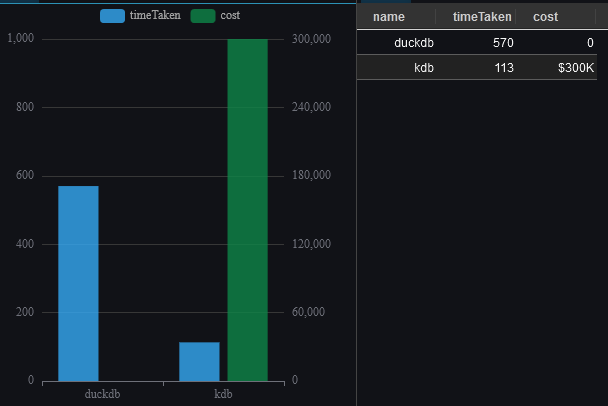
KX published an article
on medium (18th December 2024) demonstrating stock analysis using kdb+.
Can we load the same NYSE TAQ data and perform the same analysis using a free database? How will it perform?
Let's try it with DuckDB.
Loading the NYSE TAQ Trade Data
- Download the data at https://ftp.nyse.com/Historical%20Data%20Samples/DAILY%20TAQ/,
in particular the EQY_US_ALL_TRADE_20240702.gz and unzip the file. - Download QStudio which bundles DuckDB and go to File menu -> New DuckDB Database.
- Run the below SQL code to load the data into a table and to add a ttime column of the correct type.
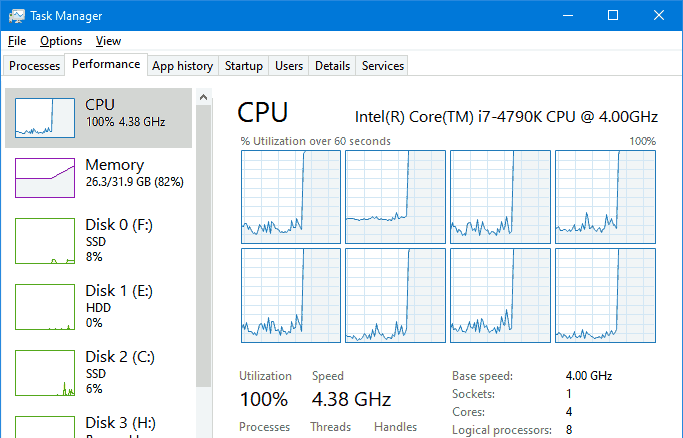
It was very cool seeing DuckDB use all my CPUs by default to load the data.
Querying the Data
| column_name | column_type | null | key | default | extra |
|---|---|---|---|---|---|
| Time | VARCHAR | YES | |||
| Exchange | VARCHAR | YES | |||
| Symbol | VARCHAR | YES | |||
| Sale Condition | VARCHAR | YES | |||
| Trade Volume | BIGINT | YES | |||
| Trade Price | DOUBLE | YES | |||
| Trade Stop Stock Indicator | VARCHAR | YES | |||
| Trade Correction Indicator | VARCHAR | YES | |||
| Sequence Number | BIGINT | YES | |||
| Trade Id | BIGINT | YES | |||
| Source of Trade | VARCHAR | YES | |||
| Trade Reporting Facility | VARCHAR | YES | |||
| Participant Timestamp | VARCHAR | YES | |||
| Trade Reporting Facility TRF Timestamp | VARCHAR | YES | |||
| Trade Through Exempt Indicator | BIGINT | YES | |||
| ttime | TIME | YES |
Example: Count the Number of Trades by Stock
This was a simple query that even I was able to write in 1 minute. The great news is that the result is the exact same as that produced by kdb+.
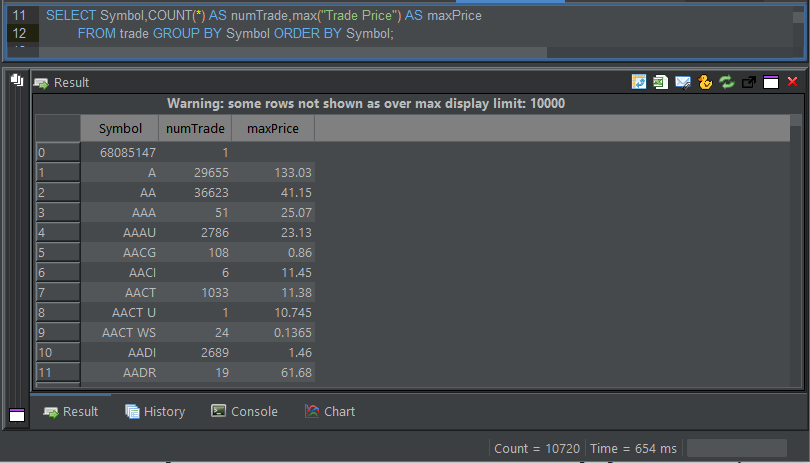
The bad news is that it's significantly slower. 500ms is fast enough that it's not interrupting my workflow but it's not close to the 113 milliseconds reported for kdb+. I tried adjusting the CPUs used and running in-memory but performance stayed similar to initial settings or got worse.

Monitoring the Trade Volume for one stock
The ttime column that I created earlier is only Time, i.e. it is NOT a timestamp or a datetime. Time seems to have less functions available than timestamp in DuckDB so rounding it to the nearest time bucket is more tricky but this did give me a chance to create a cool xbarTime function. See our time-bucketing article for more examples.
Additional to the trades within each time bar, we want to add a cumulative sum, for this we use a window function:
| earliest | total_trade_volume | sums |
|---|---|---|
| 04:00:00.01 | 10805 | 10805 |
| 04:05:05.83 | 2257 | 13062 |
| 04:10:29.05 | 1078 | 14140 |
| 04:15:10.54 | 2216 | 16356 |
| 04:20:03.30 | 1365 | 17721 |
| 04:25:02.46 | 4717 | 22438 |
| ... | .... | ..... |
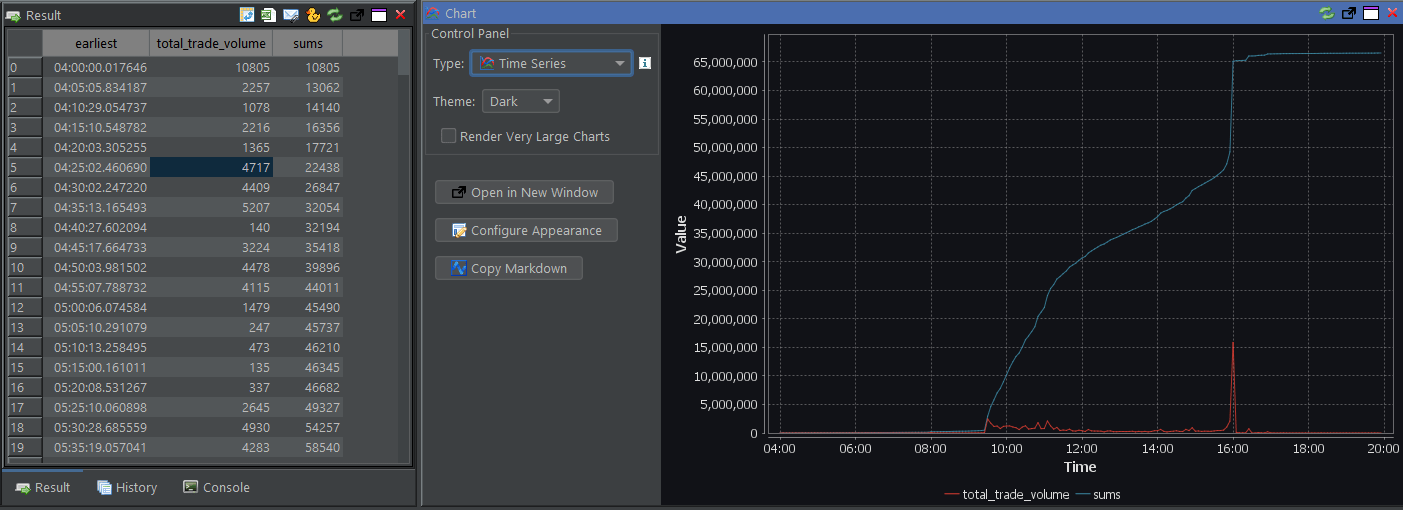
The chart was plotted in QStudio a Free SQL client with charting, it looks similar to the chart from the original article.
Volume Weighted Average
The weighted average is similar to an ordinary arithmetic mean (the most common type of average), except that instead of each of the data points contributing equally to the final average, some data points contribute more than others. In finance it is common to weight trades by the number of trades executed at a price point, to find a weighted average of all prices.
In SQL this is fairly simple and for fun I tried a second method including creating a wavg function. This gives the same result as kdb+ and takes 600ms.
| Symbol | wavg |
|---|---|
| 68085147 | |
| A | 126.02 |
| AA | 40.73 |
| AAA | 25.03 |
| AAAU | 23.01 |
| AACG | 0.81 |
| AACI | 11.37 |
| .... | ..... |
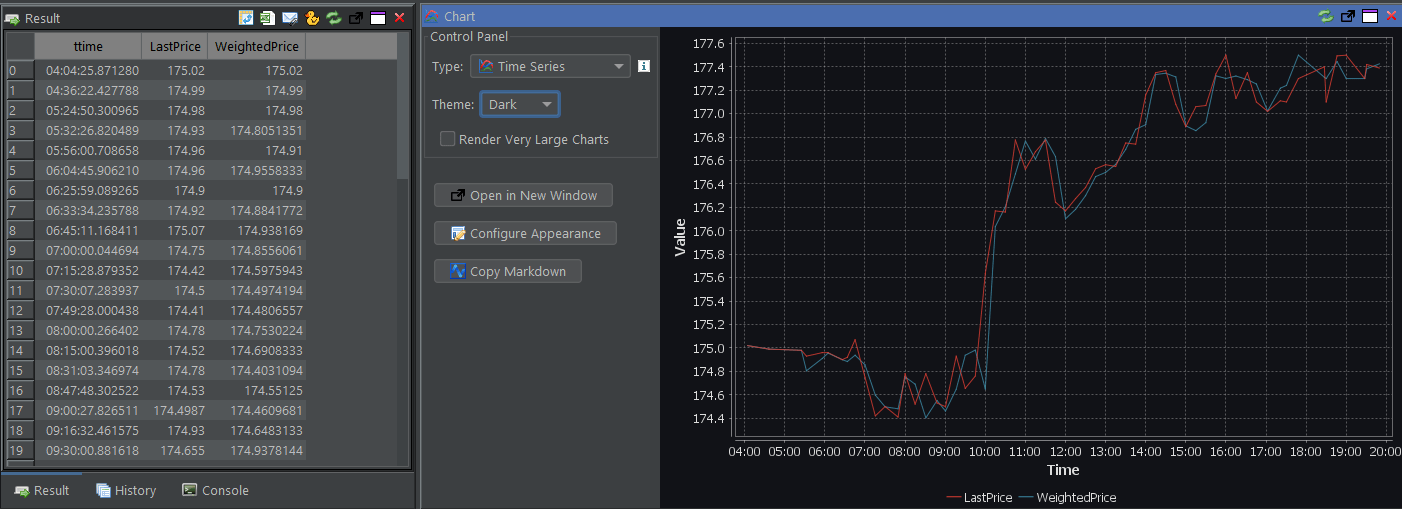
The weighted price and latest price move roughly in line similar to the original chart using kdb+ and KX developer.
Open-High-Low-Close
I've previously calculated candlestick charts in duckdb so adapting this query didn't take long:

Candlestick chart of query displayed in Pulse.
| ttime | low | open | close | high | volume | vwap |
|---|---|---|---|---|---|---|
| 04:00:00.01 | 215.89 | 216.6 | 216.11 | 216.6 | 10805 | 216.24 |
| 04:05:05.83 | 216.1 | 216.18 | 216.27 | 216.27 | 2257 | 216.15 |
| 04:10:29.05 | 216.2 | 216.28 | 216.35 | 216.35 | 1078 | 216.25 |
| 04:15:10.54 | 216.28 | 216.3 | 216.39 | 216.46 | 2216 | 216.37 |
| 04:20:03.30 | 216.24 | 216.38 | 216.26 | 216.42 | 1365 | 216.36 |
| 04:25:02.46 | 216.21 | 216.28 | 216.4 | 216.43 | 4717 | 216.32 |
| .... |
Conclusion
- We've successfully recreated every example from the kdb+ article.
- DuckDB was slower but all queries ran within a reasonable time that wouldn't disturb your workflow.
- Loading the data was easier in DuckDB.
- Time column xbar was more difficult in DuckDB and in general the SQL was more verbose.
The good news is that DuckDB is Free.
Everyone now has access to a powerful database for analysing stock data at speed. Technology that previously cost thousands of pounds annually. That's pretty cool.
QStudio is a free SQL client with DuckDB bundled and integrated, download it as the easiest way to try DuckDKB today.