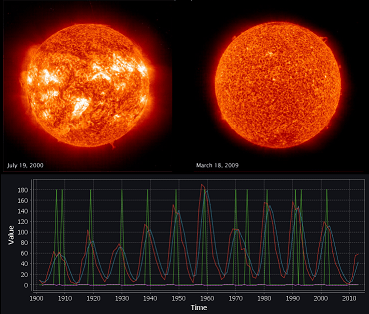
DuckDB Sunspot SQL Exercise - Finding Time-series Peaks

How to find the interval between peaks in time-series data using SQL?
The below is an SQL exercise for DuckDB to test your ability to load CSV data and to use window functions to Identify peaks and to find the intervals between peaks for time-series data. Estimated time: 15 mins.
Our Sun is always too bright to view with the naked eye, but it is far from unchanging. It experiences cycles of magnetic activity. Areas of strong activity manifest as visible spots—sunspots—on the Sun’s surface. Sunspots are temporary spots on the Sun's surface that are darker than the surrounding area.
The CSV with the raw data: https://www.timestored.com/data/sample/sunspots.csv.
Challenge: What is the time interval between peak sunspots?
| Year | Number |
|---|---|
| 2012-12-31 | 57.7 |
| 2011-12-31 | 55.7 |
| 2010-12-31 | 16.0 |
| 2009-12-31 | 3.1 |
| 2008-12-31 | 2.9 |
| 2007-12-31 | 7.0 |
| 2006-12-31 | 15.2 |
| 2005-12-31 | 29.8 |
| 2004-12-31 | 40.4 |
| 2003-12-31 | 63.7 |
| ... | ... |
| ... | ... |
Solution Shown Below. Please attempt as exercise first
Raw Data
I'm going to use QStudio as it has DuckDB builtin and allows quickly plotting the data to visually inspect our steps.
Here is the raw data loaded using read_csv. I'm using a bar chart as QStudio time-series only supports dates after 1900.
SELECT year,Number FROM read_csv('https://www.timestored.com/data/sample/sunspots.csv') ORDER BY Year;
Identify Time-Series Peaks
To identify the peaks in a time-series we can:
- Identify if the current value is increasing or decreasing compared to the previous.
- Find where the previous value was increasing and the current value is decreasing. i.e. A maximum peak / turning point.
- Extract only those rows which were a maximum turning point.
Notice I chose di=180/0 just to make it sure up easily on the graph using the same numeric axis.

Smooth the Time-Series
I've successfully identified most peaks, however some sections are identifying two peaks.
To solve this I will smooth the time-series. The simplest method is to use a simple moving average.
I replace the simple Number with avg(Number) OVER(ORDER BY year ASC ROWS BETWEEN 2 PRECEDING AND CURRENT ROW) as moving_average

Average of all Years
Now it's easy to filter only for peak sunspot years:
WHERE di=180
and sum the time period between years:
year - lag(year) OVER (ORDER BY Year)
Bringing this all together gives:
Full Window Functions Solution
This gives an answer of: 10.9627602.
Which is good since wikipedia says: "Their number varies according to the approximately 11-year solar cycle."