Stock Data Analysis using DuckDB
Presentation given at DuckCon #6 2025
This presentation will give you 2 takeaways:
- An overall impression of how DuckDB can be used in Finance.
- Show you QStudio a free SQL client first released in 2013 and that today integrates DuckDB.
Contents
If you want to run these demos yourself, download QStudio.
Bank Trading and Data Flow
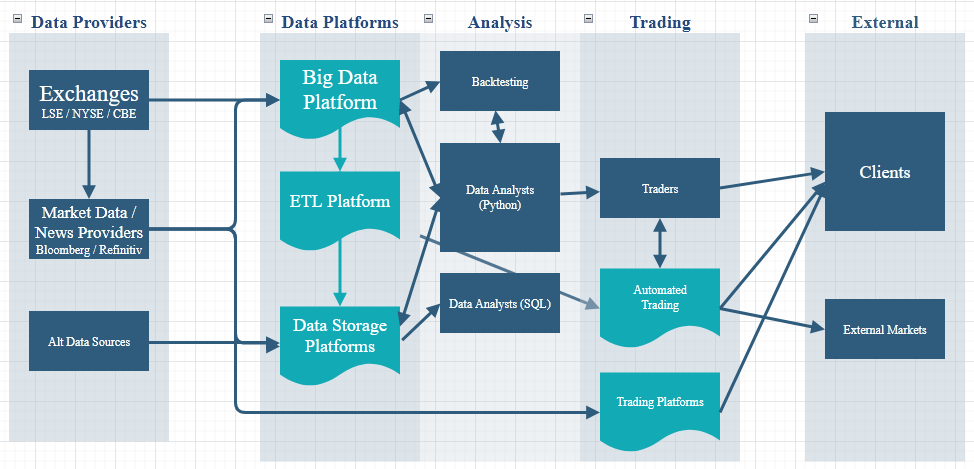
- Trading departments within Banks are large entities that consume data and either conduct trades for clients or on their own behalf on global markets
- The left-hand side of this diagram shows
- Exchanges - LSE - London Stock Exchange, NYSE, XHKG, Euronext. Basically marketplaces where very large firms can trade with each other.
- Market Data Providers - Bloomberg, refinitiv, yahoo, polygon. That aggregate various exchanges and sources for you, rather than you having to negotiate a contract with each one.
- Alternative Data Sources
- The three middle blocks: Data Platforms -> Analysis -> Trading represent the bank itself.
- Finally the right-hand side represents the bank taking actions and interacting externally with clients of conducting trades on external markets.
- Historical market data storage and analysis. e.g. Backtesting. Exchange Data Arrives -> Stored on Big Data Platform -> Used as part of framework to replay a trading strategy to predict its' profitability or risk profile.
- Local quant analysis e.g. Liquidity analysis, PnL analysis, profitability per client.
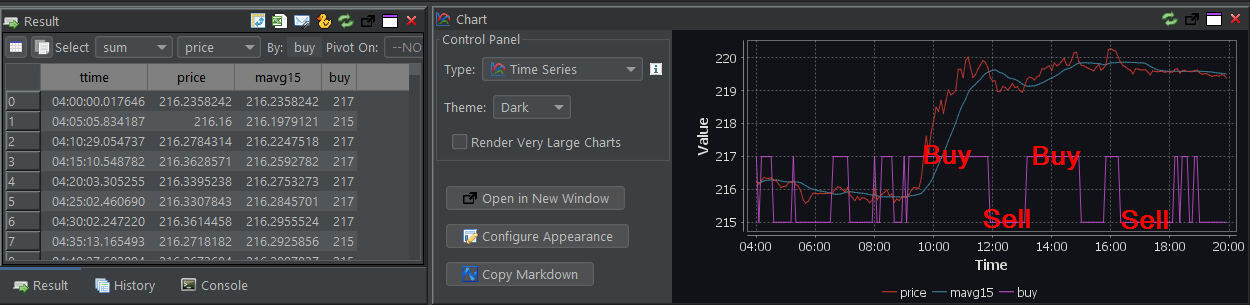
Prices aka quotes arrive from the market, the bank holds onto some stock but regularly resells it to clients via a trading platform (Like your local supermarket but at much higher speed). An analyst could be tasked with:- Examining the exchange data and the orders to see if they were executed well.
- Examining everything that each client bought and sold and trying to find the profit or loss the bank made for that particular customer.
- Real-time Streaming Calculation Engines e.g. Streaming VWAP, Streaming TCA
- Download the data at https://ftp.nyse.com/Historical%20Data%20Samples/DAILY%20TAQ/,
in particular the EQY_US_ALL_TRADE_20240702.gz and unzip the file. - Download QStudio which bundles DuckDB and go to File menu -> New DuckDB Database.
- Run the below SQL code to load the data into a table and to add a ttime column of the correct type.
Example Finance Use-cases
Local Quant Analysis
DuckDB is a powerful tool for local data analysis and I believe that's currently where it could best be used in finance. So let's look at real examples:
Loading the NYSE TAQ Trade Data
Querying the Data
| column_name | column_type | null | key | default | extra |
|---|---|---|---|---|---|
| Time | VARCHAR | YES | |||
| Exchange | VARCHAR | YES | |||
| Symbol | VARCHAR | YES | |||
| Sale Condition | VARCHAR | YES | |||
| Trade Volume | BIGINT | YES | |||
| Trade Price | DOUBLE | YES | |||
| Trade Stop Stock Indicator | VARCHAR | YES | |||
| Trade Correction Indicator | VARCHAR | YES | |||
| Sequence Number | BIGINT | YES | |||
| Trade Id | BIGINT | YES | |||
| Source of Trade | VARCHAR | YES | |||
| Trade Reporting Facility | VARCHAR | YES | |||
| Participant Timestamp | VARCHAR | YES | |||
| Trade Reporting Facility TRF Timestamp | VARCHAR | YES | |||
| Trade Through Exempt Indicator | BIGINT | YES | |||
| ttime | TIME | YES |
VWAP Volume Weighted Average Price
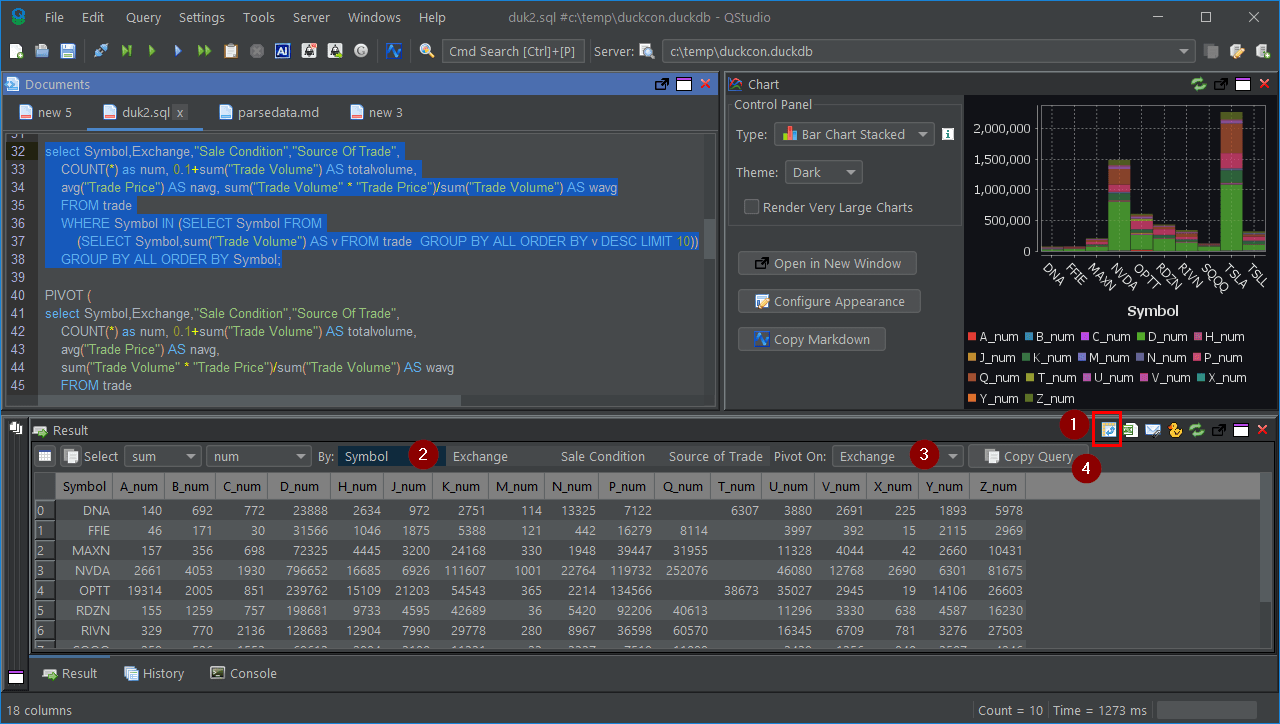
DuckDB Pivot
Pivot tables allow exploring data easily. QStudio allows click and select to change pivots, leveraging the power of duckdb pivots and allowing you to (4) copy the pivot query.
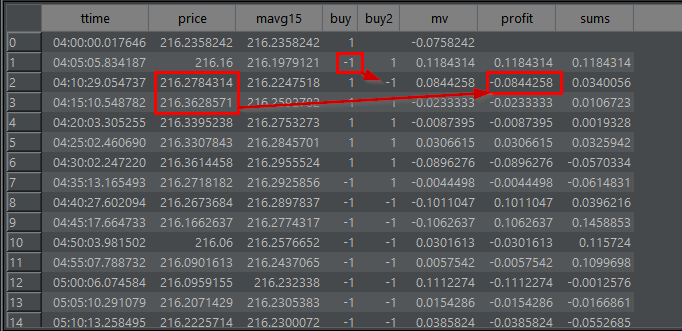
Candlesticks are easy with window functions
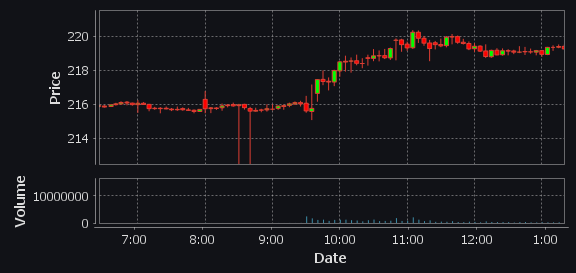
How to make money with window functions