Creating Live PostgreSQL Charts
Contents
- Creating new PostgreSQL Database - init and adding some data.
- Adding a PostgreSQL Server
- Populating Data
- Adding our First Charts
- Adding an OHLC - Open High Low Close chart
- User Interaction with Forms
- Inserting more data to see a live chart update
Note: The video above reuses footage from a MySQL database in places.
All code below is postgresql and all the same steps were tested and working in postgresql 15. Date: 2022-11-14.
Creating new PostgreSQL Database
Create an empty database and grant pulseuser access:

Add PostgreSQL Server Connection
To add a connection goto Connections->"Add Data Connection" and fill in your details.
You can try clicking test to see if the connection works before adding it.

Populating the Tables
Copy and Paste the below code into the SQL Editor and press "Send Query":
You can run "select * FROM ohlc LIMIT 10;" to check the data is there:

Adding our First Charts
- On the dashboards listing page, click add

- Click on the newly created dashboard to go into it. Either click on edit or toggle design mode once in the dashboard.

- On the component bar, click "Time Series" to add a chart.

- Within the Editor
- Select the PostgreSQL server
- Enter the query:
select date,adjClose from ohlc where sym='GOOG';

Adding a Table
- On the component bar, click table to add a table.
- Within the Editor
- Select the PostgreSQL server
- Enter the query:
select * from stock where sym='GOOG';
Adding an OHLC Chart
The next SQL chart we want is a candlestick:
select date,open,high,low,close,volume from ohlc where sym='AMZN' ORDER BY date desc LIMIT 100;
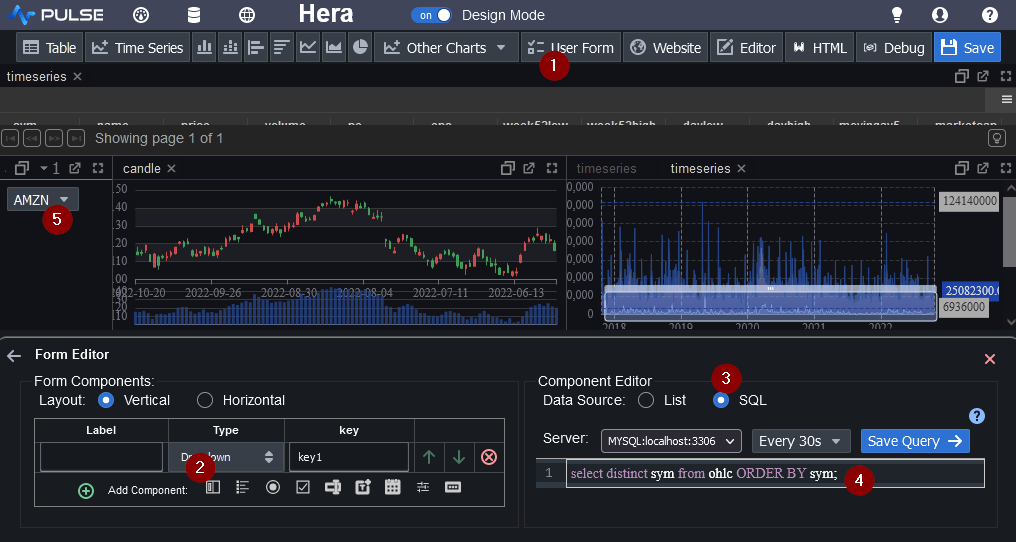
User Interaction with Forms

Forms allow user interaction by placing user input within the SQL queries. To create one:
- Click "User Form" on the component bar to add that component.
- Within the Editor, click "Add Component" to add a dropdown component.
- Within the Component Editor, select SQL as the data source
- Specify the query:
select distinct sym from ohlc ORDER BY sym; - Click the dropdown button to test it.
Using Form Values in Charts
To use form values in charts, we use the key name surrounded by parentheses e.g. ((key1)).
The SQL code then changes from/to:
select date,adjClose from ohlc where sym='GOOG';
select date,adjClose from ohlc where sym=((key1));
Similarly update the other chart queries
Inserting more data to see a Live Chart Update
- Add another time-series chart
- Specify the query:
select * from quote where sym='GOOG' ORDER BY time desc; - Specify a 1 second refresh time
- Copy paste the below code into the code editor
- Press Ctrl+Enter to run one line, then the next and so on.
As you run each line the chart should update.

