
Creating kdb+ Trader Dashboards
Contents
kdb+ Trader Dashboards

Trader Screens typically fall into 4 categories:
- Context – News / Prices
- Action – Change algo config or execute trades.
- Position – Current Net position, 5 min PnL
- Trades
It is particular well suited for displaying real-time trade blotters, price graphs or any context/position data for traders.
Download Pulse
Add kdb+ Server Connection
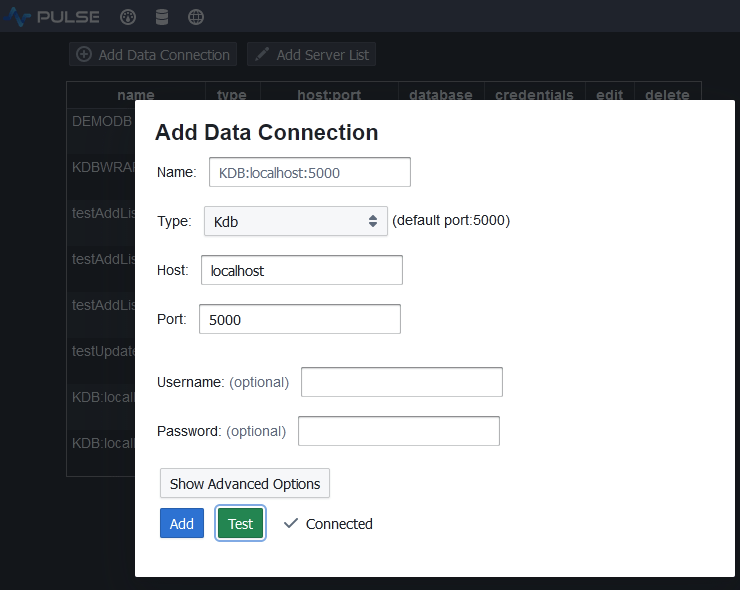
To add a connection goto Connections->"Add Data Connection" and fill in your details.
You can try clicking test to see if the connection works before adding it.
Populating the Tables
Copy and Paste the below code into the SQL Editor and press "Send Query":
You can run "-10 sublist trade" to check the data is there:
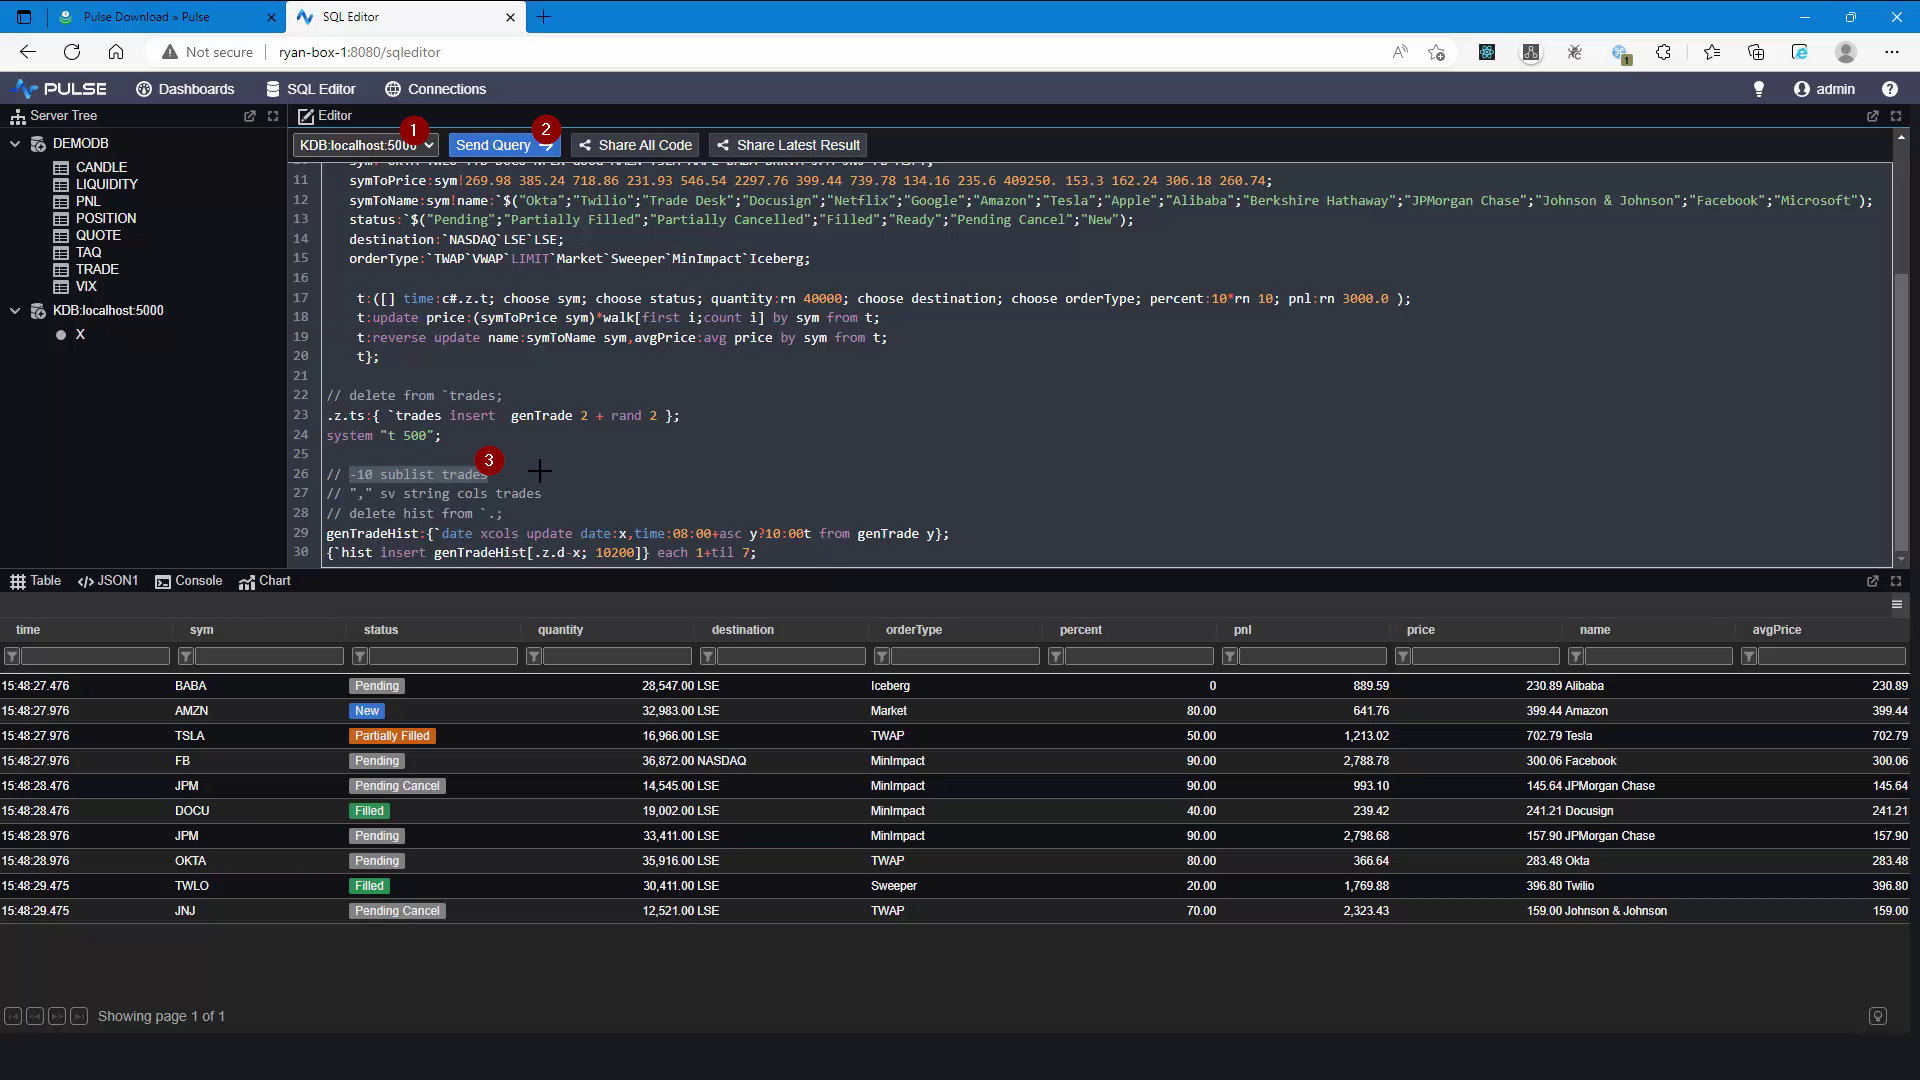
- Make sure your data source is selected
- Enter your SQL query, click save or highlight all text and press ctrl+E
- Highlight
-10 sublist tradesand press Ctrl+E to run only that code
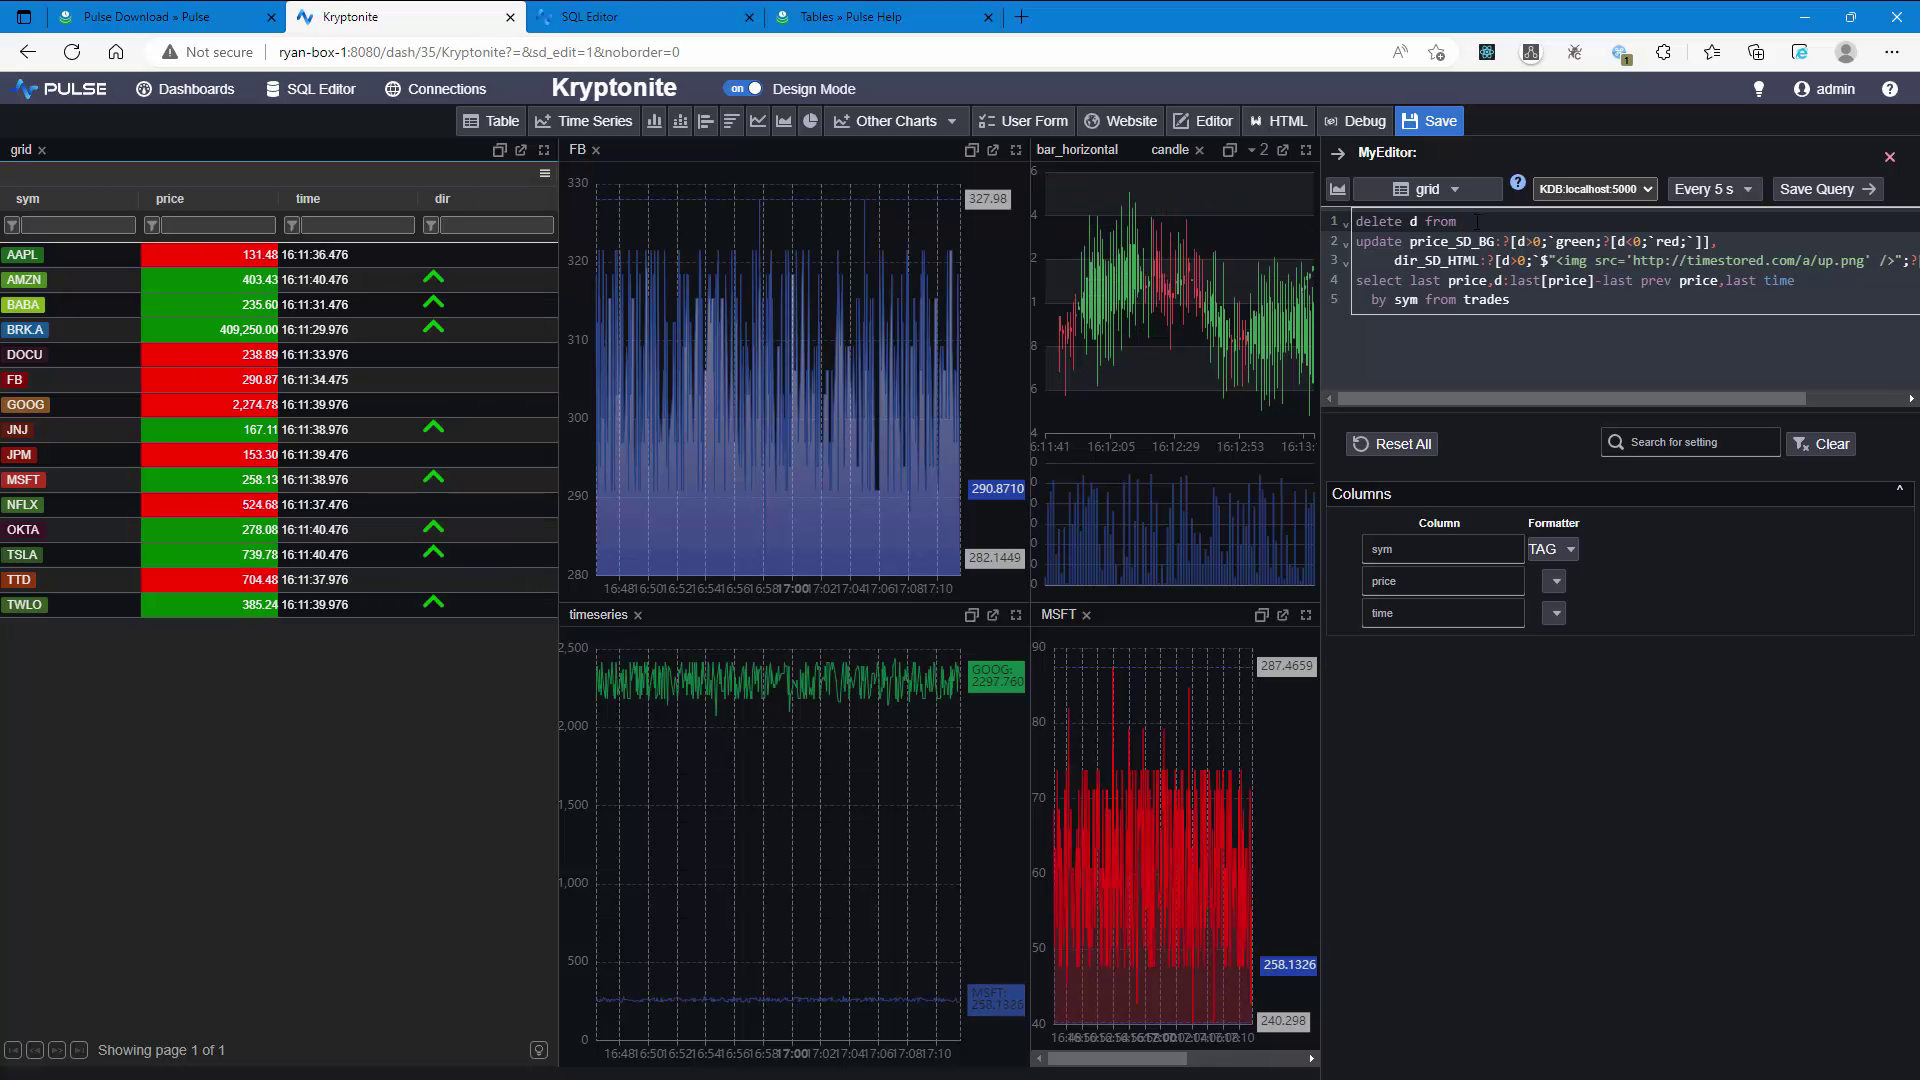
Real-Time Trade Blotter
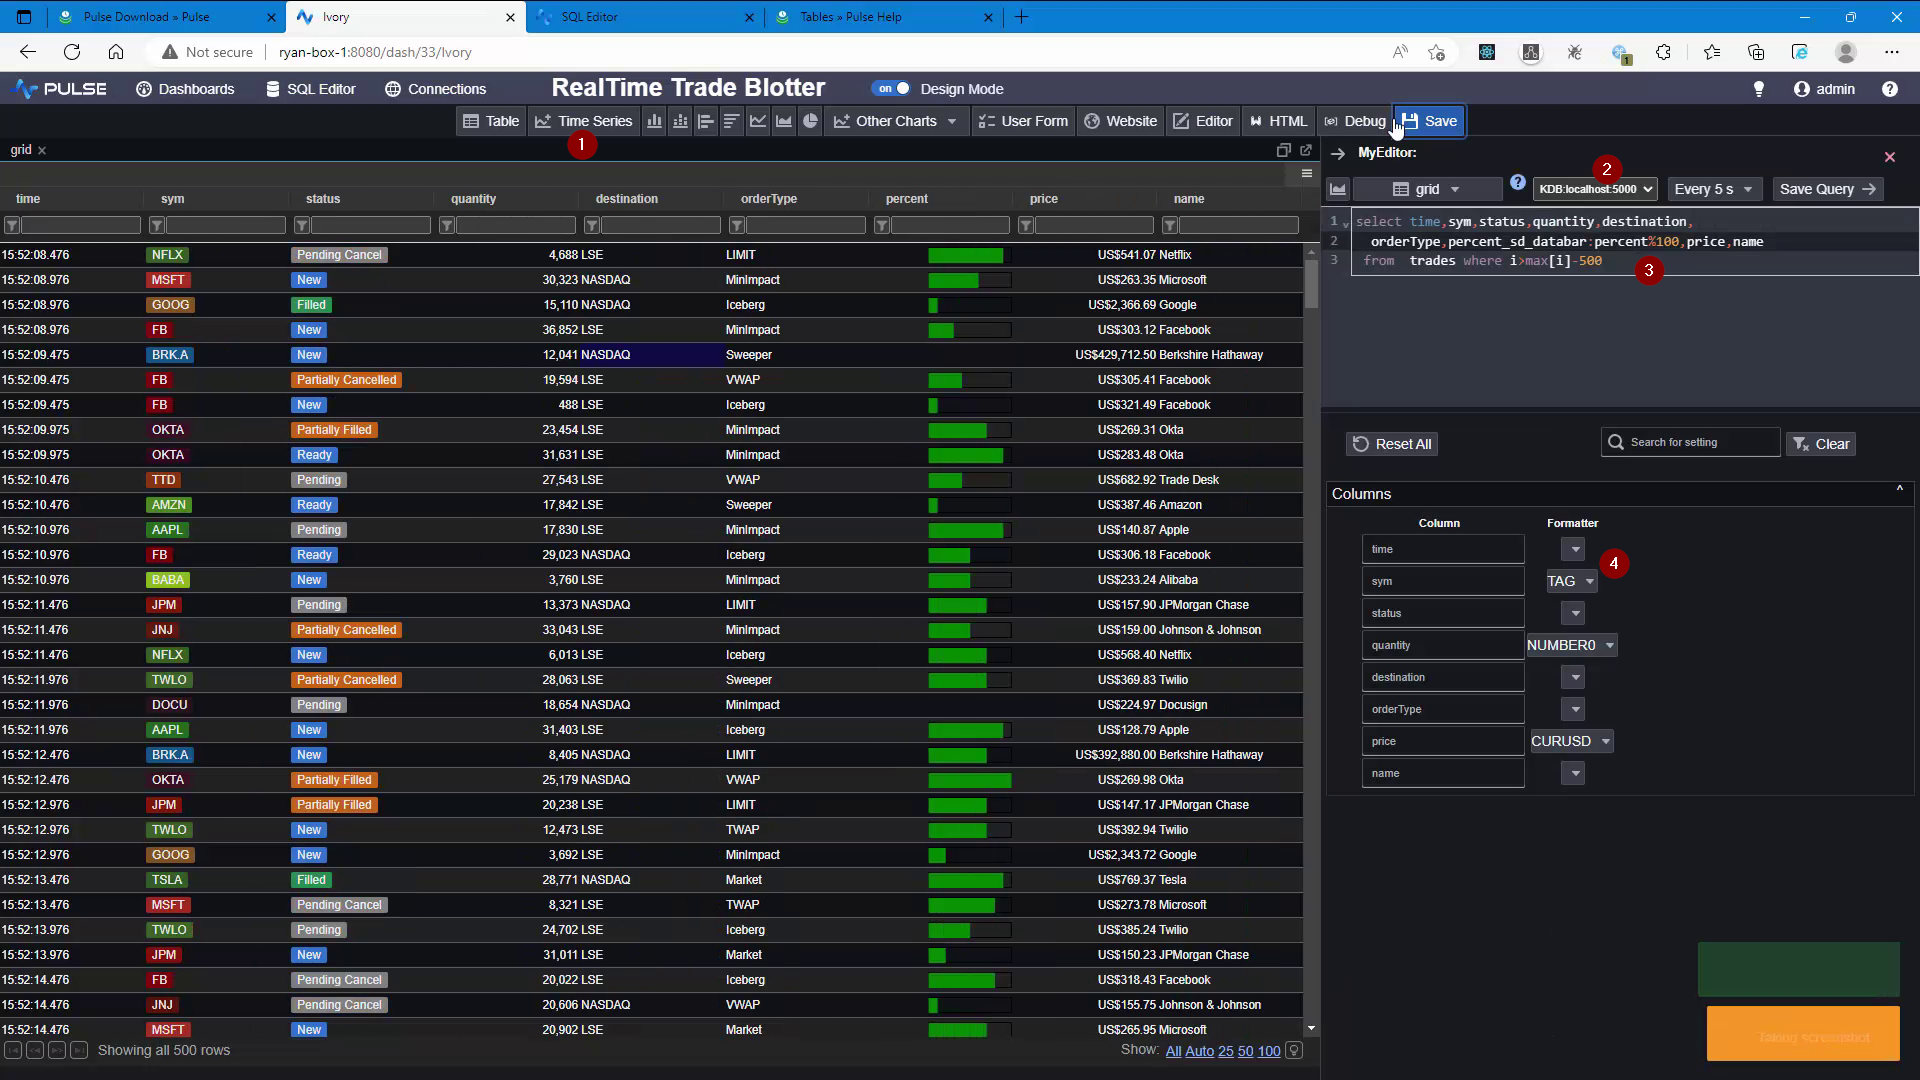
First make sure you are in design-mode else click the toggle at the top of the dashboard. This should add a top panel that allows you to add components.
- Click Time-Series to add that chart
- Make sure your data source is selected
- Enter your SQL query, click save or press ctrl+E
- Set the column formatters
Historic Trade Blotter
Copy existing real-time dashboard to get the same formatting. Then add the form components and update the query.
- Click "User Form" to add a user form to the dashboard. Then move and resize it as you want
- Within the Form Editor, click Add Component for the type of user input you want
- Once the component is added, you can edit it in the "Component Editor". Shown in the image is the numeric editor.
The dropdown/select editors allow specifying a hardcoded list of values or a dynamic SQL query - Set the keys that you want in the form, so that you can use them in your query
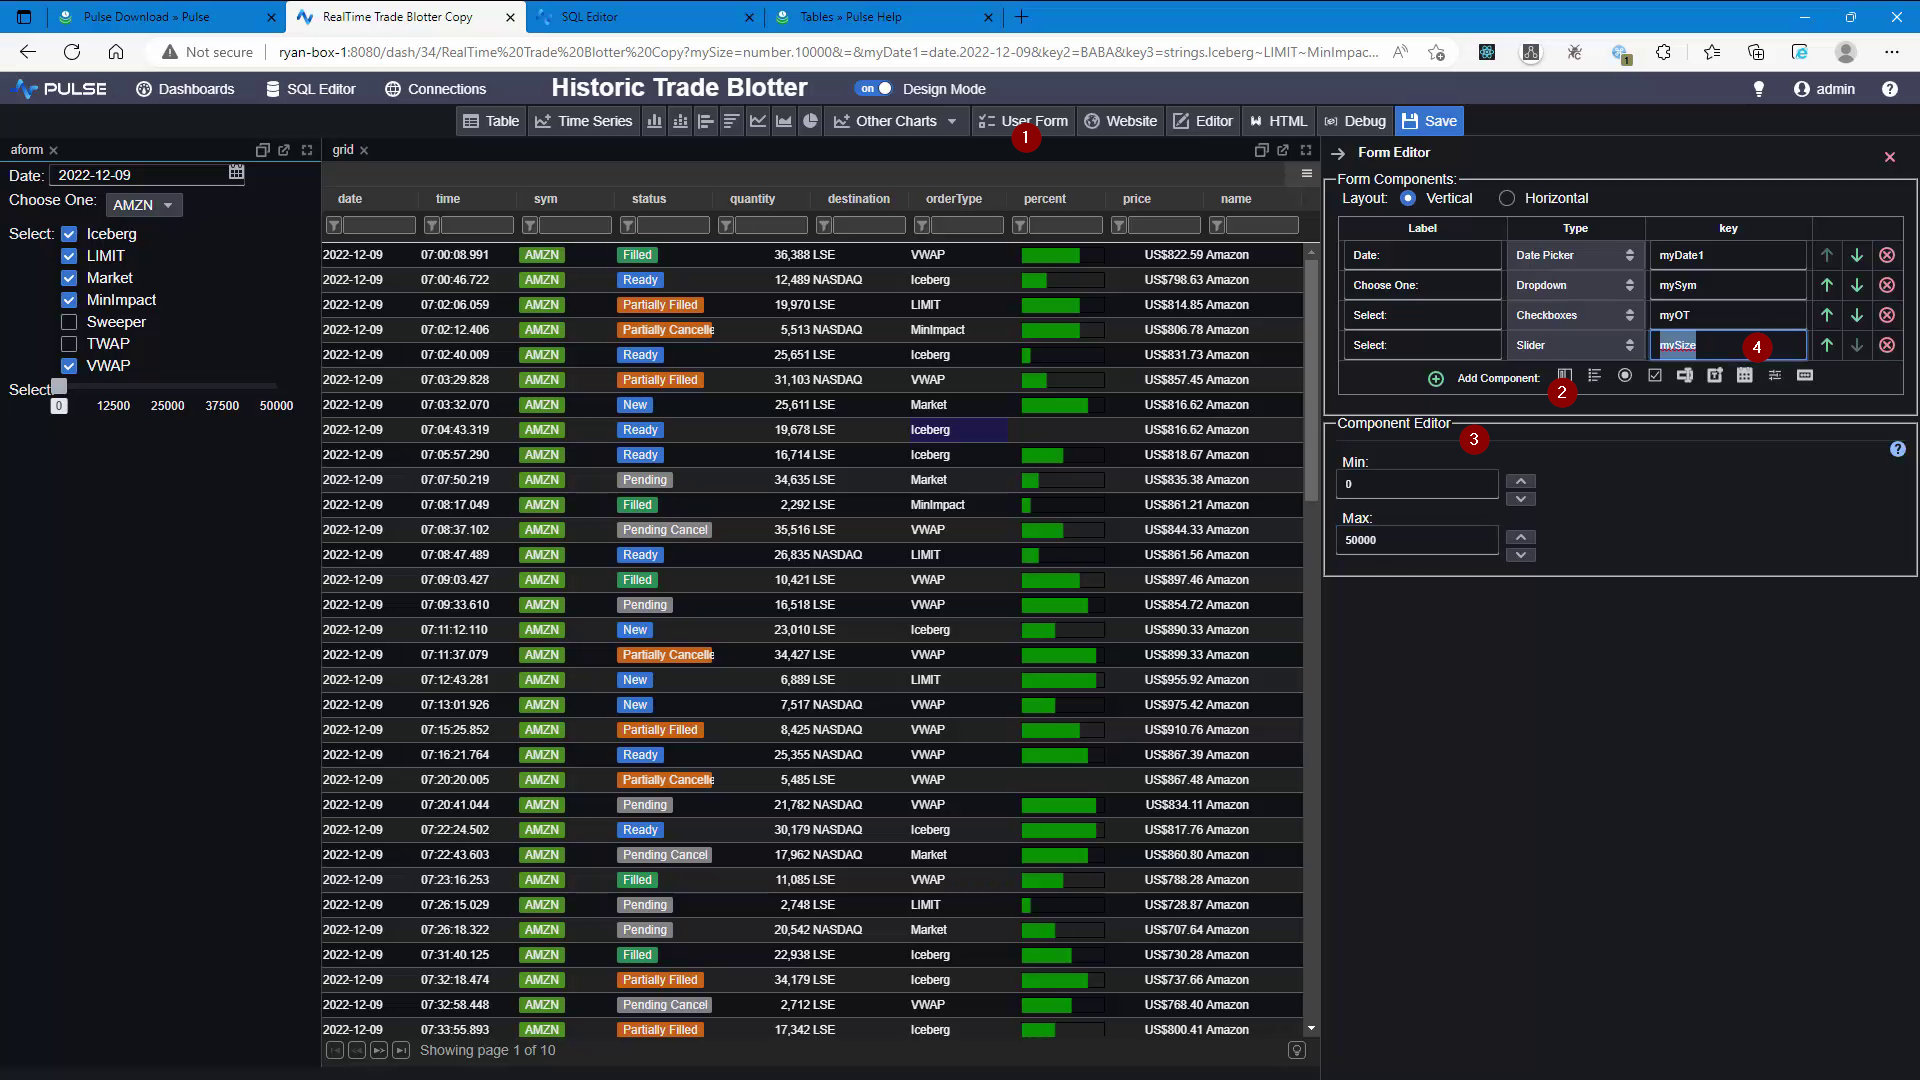
Add a user form component for each of these:
Select values for each input. Then update the query to:
Price Graphs
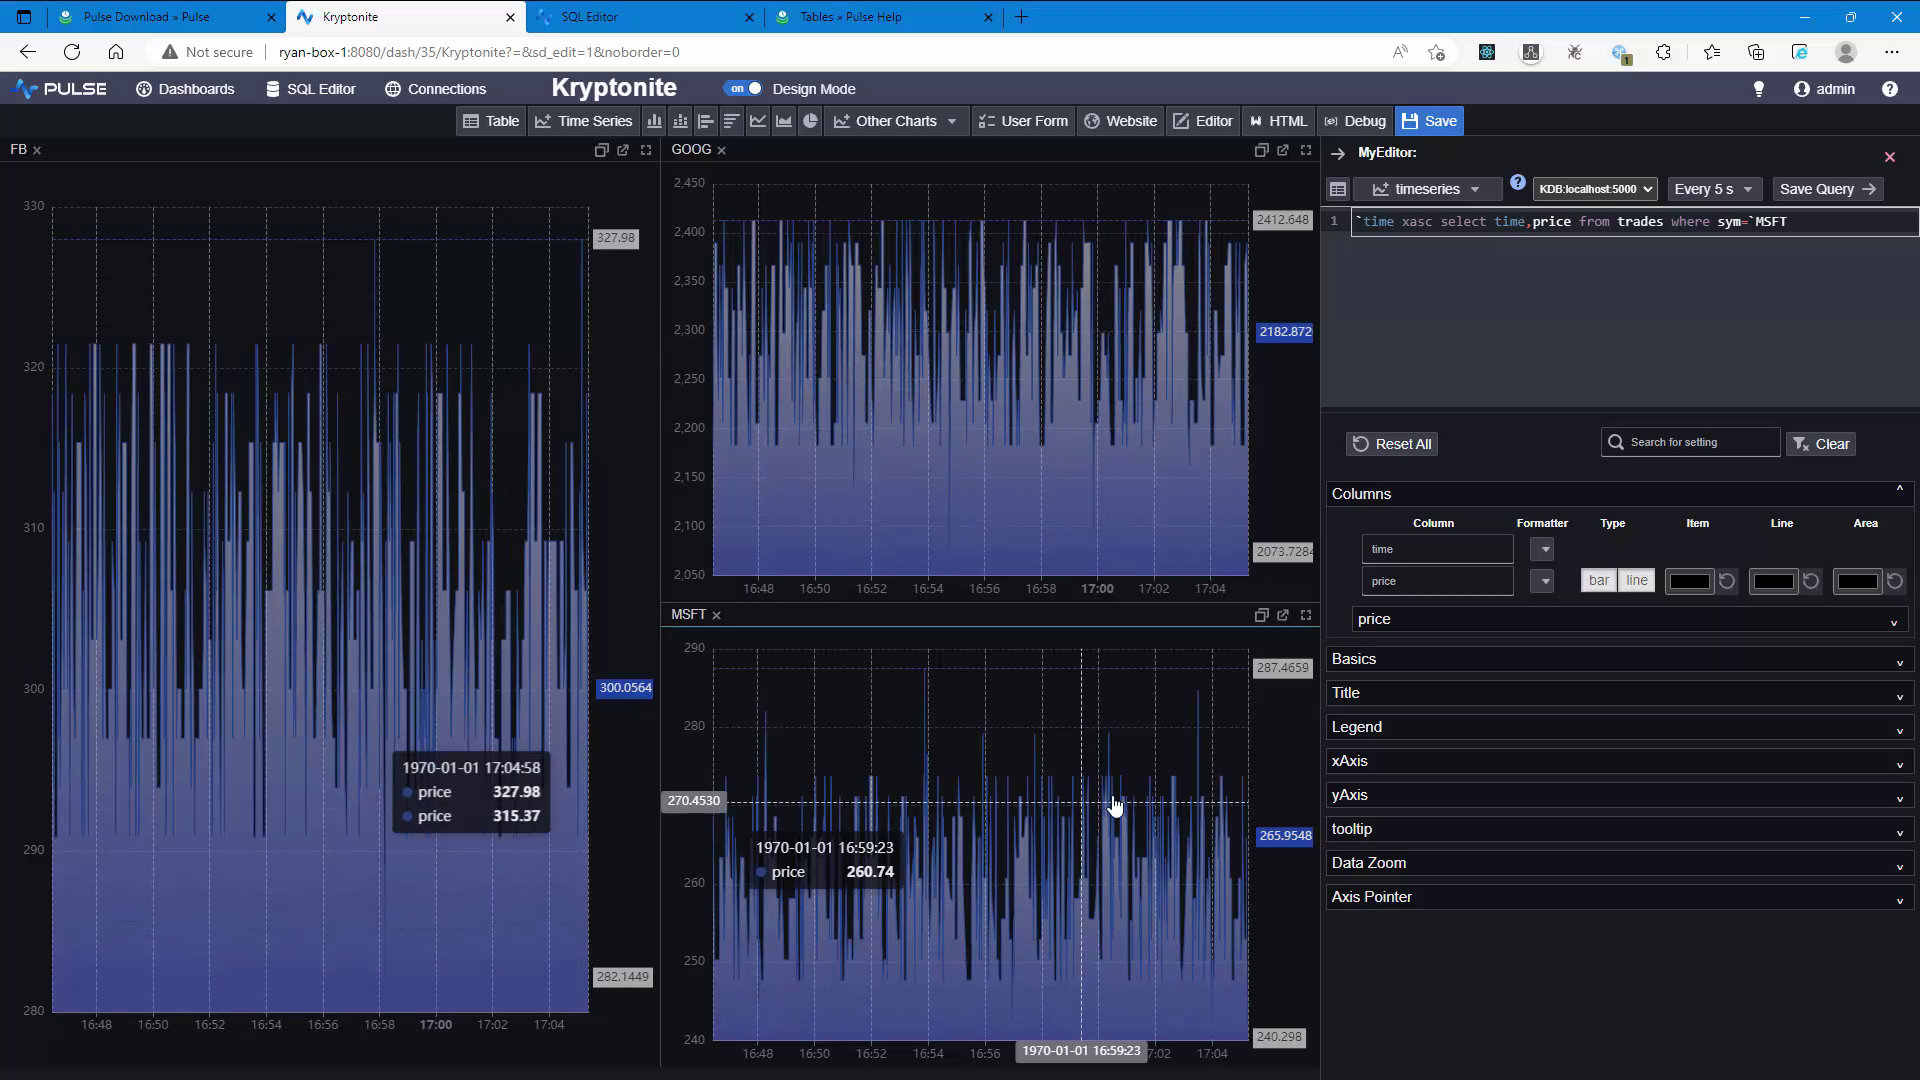
- Click "Time Series" to add a time-series chart.
- Enter
`time xasc select time,price from trades where sym=`FBto plot a single series. - Enter
`time xasc (uj/) {(`time,x) xcol 1!select time,price from trades where sym=x} each `FB`MSFTto plot multiple series in one chart.
- Click "Table" to add a new table component
- Update the query to below:
Thanks for watching our demo. Please download Pulse to give it a try for yourself.