Archive Page 5
March 2nd, 2023 by Ryan Hamilton
We’ve added a new tutorial and demo, creating a crytpo dashboard with QuestDB backend:
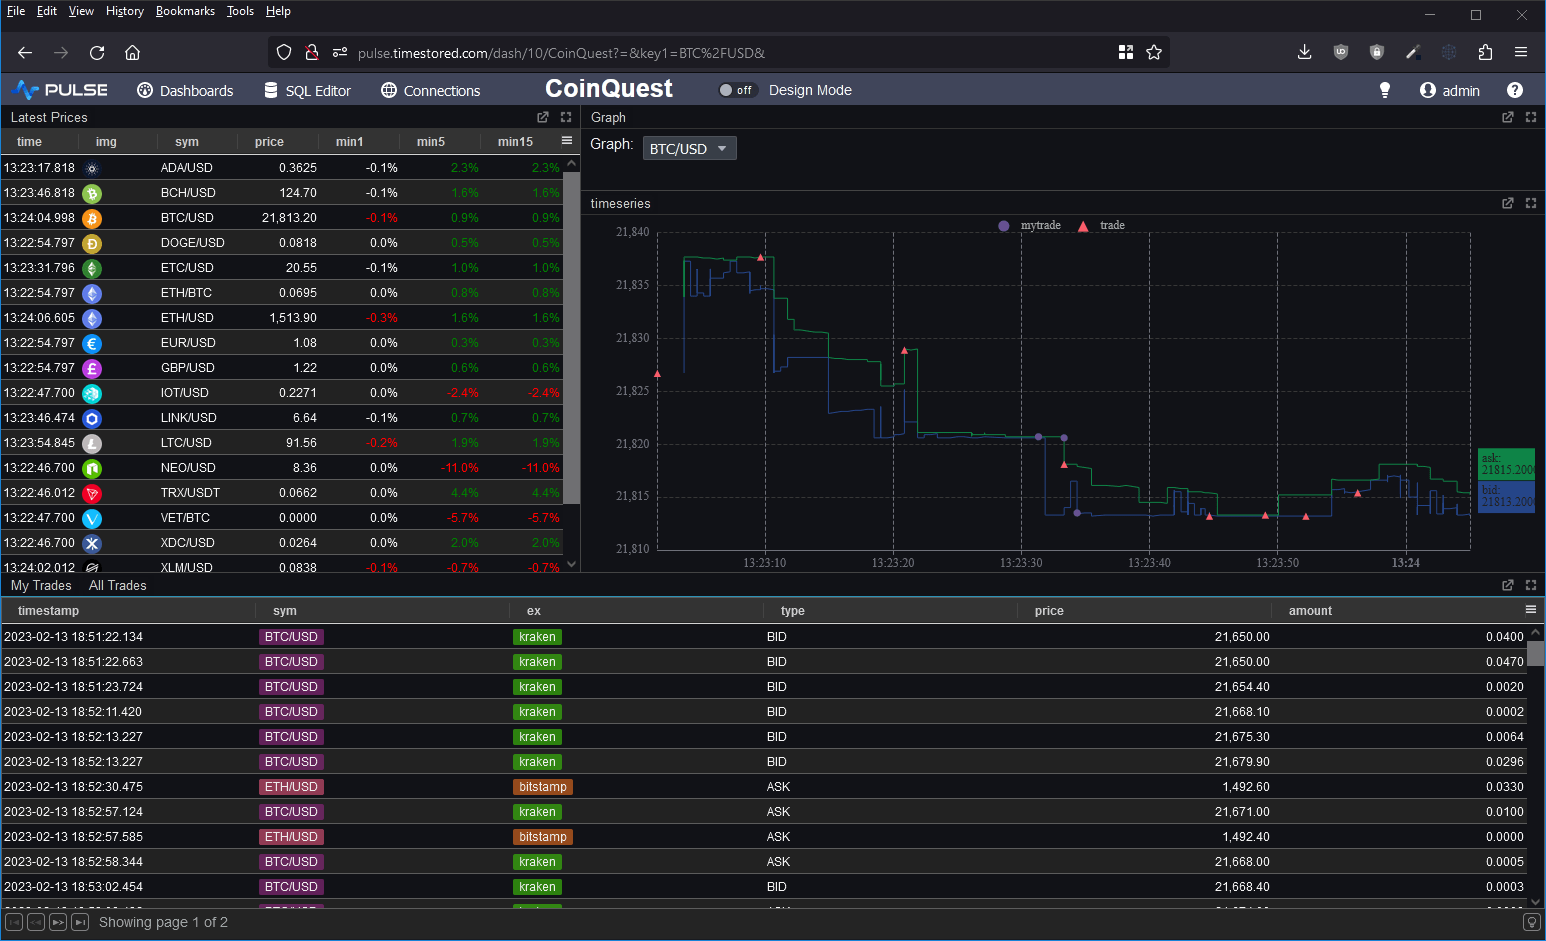
Pulse – Real-time interactive Dashboards 0.14.1 adds a Metrics Panel.
Allows tracking headline text while still showing the trend as a background chart.

March 2nd, 2023 by Ryan Hamilton
qStudio recently celebrated it’s tenth birthday and it’s still continuing to be the main IDE for many kdb+ developers. We want to keep making it better. Version 2.0 now includes
If you’ve been using qStudio, we would love to hear your feedback, please get in touch.

Download qStudio
February 16th, 2023 by Ryan Hamilton
This article is (part 2) of a series. See the previous post on “2018 – The Future of Tech in Banks, particularly within Market Data“.
The previous article described a few problems with the current tech/finance structure in most banks. In the words of Jim Barksdale:
“there are two ways to make money. You can bundle, or you can unbundle.”
In this case we can see two possible solutions:
- Horizontal Integration – Providing a bundled reliable layer e.g. AWS to solve your hardware needs
- Vertical Integration – Providing a front to back solution, SAAS – Software-As-A-Service e.g. github hosting, third-party trading platform.
Horizontal Integration AWS – To Solve hardware layer

Consider the example of outsourcing: “AWS for hardware”, it makes 100% sense, there is very little customization or unknown capability with 95%+ of servers for application use within a bank being fairly standard. The area where this currently becomes problematic is high-performance and co-location, to cover those needs hybrid-cloud could help. The benefits and savings in other areas, security/reliability/costs can often out weight the drawbacks. In my opinion most internal cloud solutions will dissapear within the next few years.
Benefits of Bundling/Outsourcing
Solutions rely on the problem being well known/understood and that all inputs/outputs to the bound box can be well defined. They work by:
- Preventing duplication of effort – Designed to be re-used
- Reducing communication overhead – Everything within their box is a service with APIs or configurable. No meetings/Change tickets required (OK less. There will always be change tickets!).
- Preventing misalignment and Misalignment of incentives -One entity is responsible for full delivery and if outsourced can be scaled up or down at little overhead/risk to the bank.
Vertical Integration – Outsourced Market Data-As-A-Service

An example of vertical integration would be “Market Data-As-A-Service”. If every bank has the same market data problem and we can get the benefits of buying that bundle, should we?
The danger is that it takes years to evolve to an “API” that covers 95% of the needs and even then you have to be careful that you don’t over allocate resources on something that the user actually has little value for. This is harder to know as an external entity as you don’t sit with the customer.
So given that banks have 3 options:
– Keep separate teams
– Use horizontal solutions
– Use vertical solutions
What should they do? When?
Ultimately it will be a combination of parts that evolve over time but if the problem is shared by all banks the solution is using off-the-shelf software eventually.
The market-data/feeds team should at all times be asking:
- Should we build this?
- Is this a problem specific to this bank that will add value?
- Or is it a general problem where we can take advantage of economies of scale?
Conclusion
Outsourced Solutions for Market Data – currently make less sense. As:
– Even if we can outsource storage of market data, we need a way to store our own trade date and other internal data sets.
– Column Oriented Storage – is becoming a commoditized technology. A number of firms including the major ones such as AWS are bringing user friendliness, reliability and general availability of what used to be a niche technology.
– Over recent years, firms including HFT have captured a lot of value by having in-depth market data knowledge.
The market data teams should begin to learn redshift/google/AWS solutions for as they scale to all firms everywhere the savings are massive.
Open Solutions
So far we mostly considered outsourced commercial solutions to solve the common problems. That however is not the only approach. It would be possible to reap the same, if not more benefits from an open core model. e.g. An open source trading system, that every bank makes commits to improve only keeping closed source the parts that are uniquely valuable to their business. Unfortunately in practice so far this seems to be less viable as any entity that pushes adoption of the platform, realizes costs pushing it while not capturing much value. Whereas closed source, the company incurs the marketing costs but can get this back in licensing fees.
February 6th, 2023 by Ryan Hamilton
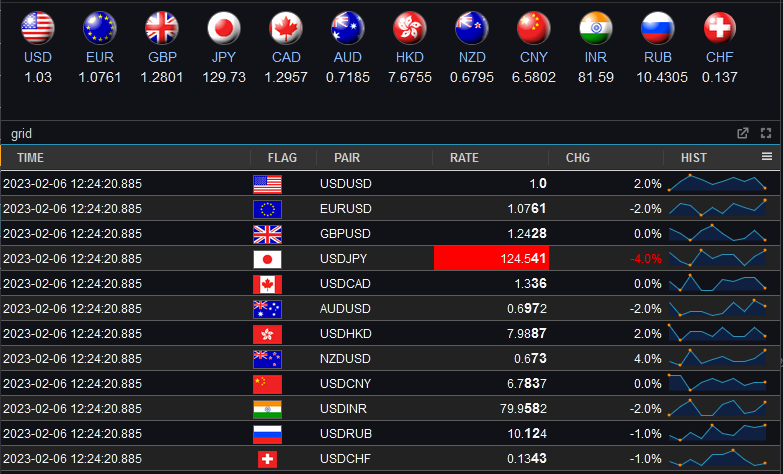
Pulse – Real-time interactive Dashboards 0.13.5 adds Sparkline and Dynamic HTML support
- Dynamic HTML – Full user control to generate HTML using template languages
- Sparklines – Embed small charts within a table by specifying nested arrays.
DOWNLOAD NOW

Pulse is designed to provide real-time interactive dashboards so the underlying database has to be really fast. Pulse can support almost any data source, the question is which databases are worth supporting.
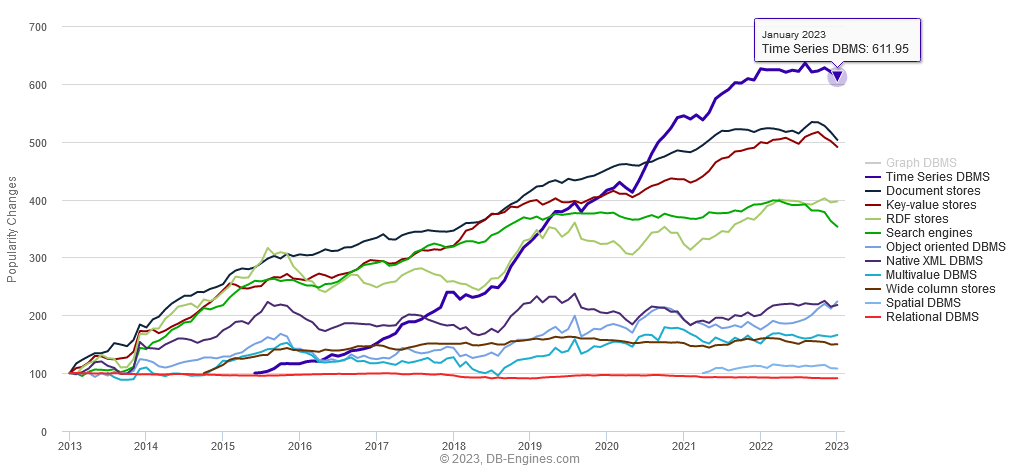
Time-series databases are the fastest growing database sector (image below).
The great news is that in the last few years there has been a a lot of interesting new entrants. So we’ve updated our past articles:
- Top Column-Oriented Databases – DuckDB, Clickhouse and Doris are the new exciting entrants. Benchmark results in article.
- Top Time-Series Databases – Have exploded in popularity. QuestDB and TimeScale are the new entrants there. Benchmark results in article.
January 23rd, 2023 by John Dempster
It’s a New Year, traditionally the time to consider a potential job change.
To help your search we have:
December 7th, 2022 by Ryan Hamilton
I present the kdb+ learning curve:
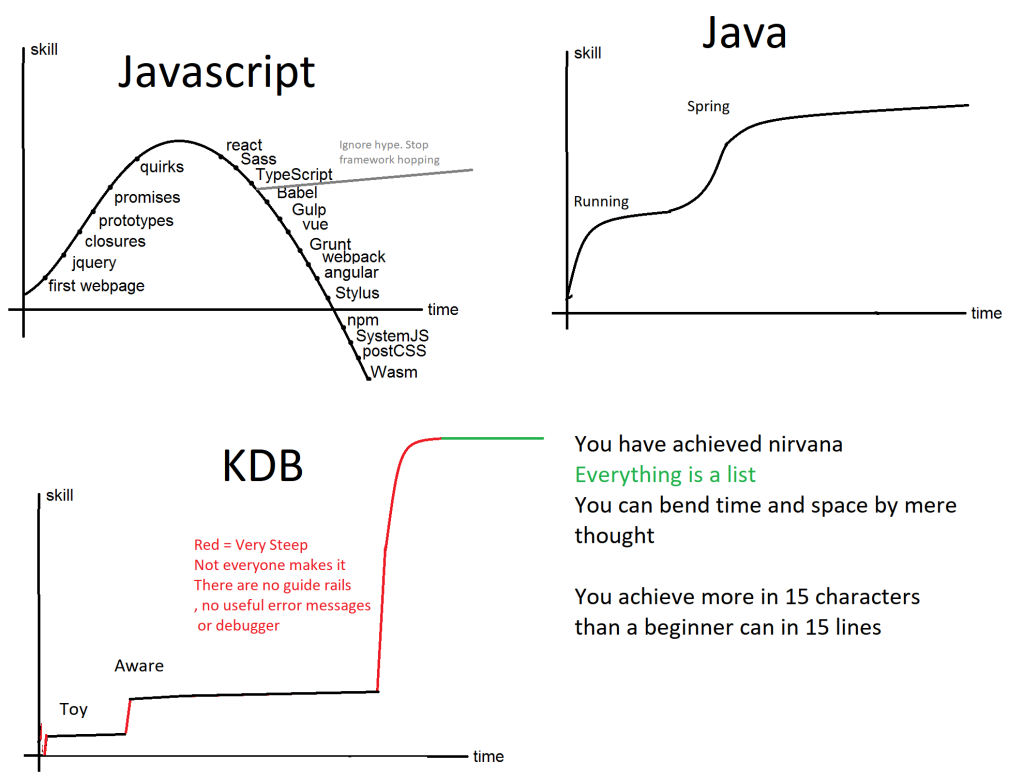
Admittedly it has got a little better in the last ten years:
– Google will return some results that may contain useful solutions
– The documentation online has grown massively. q for mortals, timestored material
– There have been multiple books written
But very little has changed to make the language more friendly.
– There is a debugger but it’s not very user friendly.
– The error messages are still cryptic
Some parts probably can’t be helped…. right-to-left recursion is always going to surprise people but it would be nice to see some attempts.
November 29th, 2022 by John Dempster
A massive thanks for those that got in touch last month to wish us well on our new product launch. It has been exciting seeing the uptake and receiving user feedback. A particularly big thanks to JP/VS/JC/IL and MC.
Based on user requests, the largest developments since last month have been:
- Security integration – to allow firm wide rollout. We now support both Apache proxies and kdb based authentication.
- Chart Customization – Configuration of 100+ chart attributes from the UI.
- Improved PostgreSQL support – Expanded query support and updated drivers.
If you need fast visualization or tableau is proving too slow, this is your chance to get in early and help steer development to solve your problem.
Contact us, if you have any feedback or need assistance with configuration.
Issues can be posted to github and source is available for customers.

Pulse – kdb+ Streaming Subscriptions

Pulse – example customization

November 29th, 2022 by John Dempster


// Real-time kdb+ data visualization
Pulse is a tool that allows you to create and share real-time interactive dashboards with your team.
It’s been almost ten years since the launch of qStudio and our original sqlDashboards.
We have seen the need for fast real-time interactive dashboards increase.
Quants increasingly want to build, deploy and roll out visualizations faster and more reliably.
As such we are excited to annnounce Pulse, an HTML5/react based solution that allows you to build a dashboards based on kdb+ or postgresql or mysql data.
It’s early days and the product is under heavy development:
- New features will be released at least monthly
- We expect to offer a 1 year license for £199
- A free 50-day trial version can be downloaded at timestored.com/pulse
If you have a need for fast visualizations that you haven’t solved or tableau is proving too slow, this is your chance to get in early and help steer development to solve your problem.

October 12th, 2022 by Ryan Hamilton
qStudio is the number one code editor, server browser and development environment for kdb+.
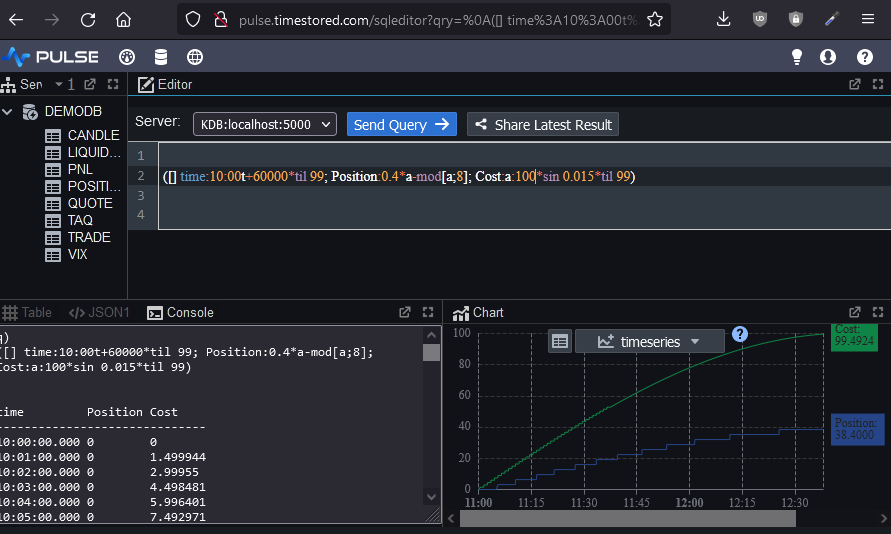
Today we are launching Pulse, a real-time SQL visualization tool for almost any SQL database.
Within Pulse we have recreated almost all the functionality of qStudio in web form.
If you’ve ever wanted to:
- Share queries and results
- Run analysis from any machine with a browser without a need to install qStudio
- Chart results using a modern charting library
You should consider using Pulse as a shared HTML5 based complement to qStudio..
As you can see below, pulse can be made to look almost the exact same as qStudio. It features the familiar configurable layout with a table/console/charting result panel that allows you to see your result in all formats at once.
Additionally you can
- Bookmark,copy and share links
- Use it with kdb+, postgresql, mysql, oracle and H2 databases
- Try many more chart types including 3D.
Try Pulse Now
June 13th, 2021 by admin
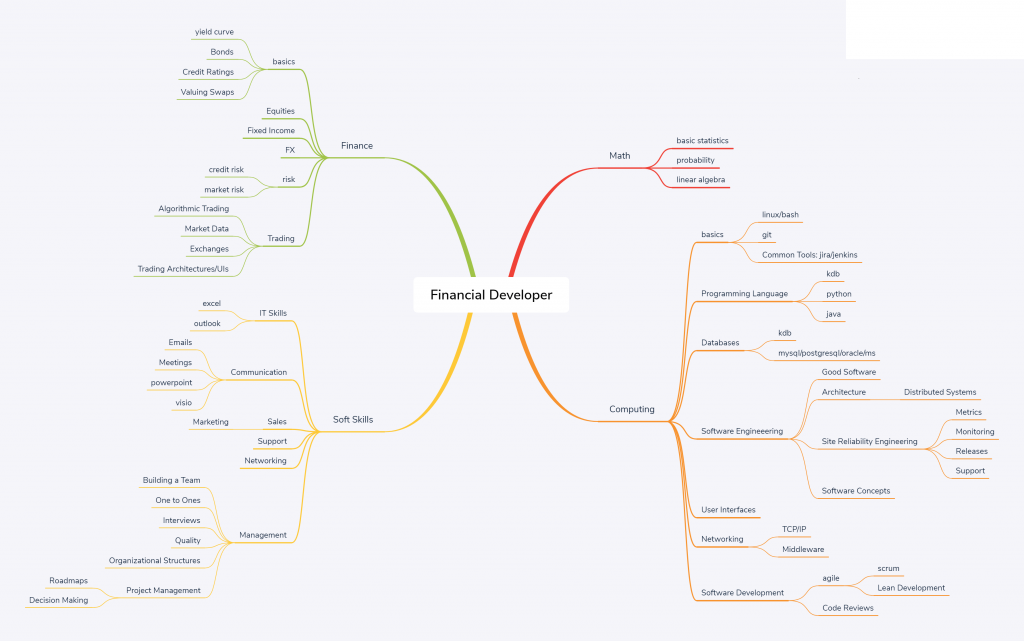
The below network diagram is intended as an outline of the skill set required for a financial software developer.
Note:
- Most individuals should aim to have a strong core. Think of it like a pyramid, where the height is the strength of a skill. Core skills like general computing principles, probability, communication should be built “tall” and very strong. peripheral skills such as python/monitoring will be weaker. An individual will typically only learn 1 or 2 niche areas strongly (T shaped)
- Notice the rough relative sizes of the areas. 55% computing, 10% math, 15% soft skills, 20% finance. This is intended to represent the rough allocation of effort.
- If you only bring 95% techinical skills, you are going to waste time building the wrong thing, build something no one wants or build something useful but no one will know as you haven’t the soft skills to sell it.
- The management branch on the bottom left is optional.
Computing
| Skill |
Topic |
Sub-Topic |
Links |
Requirement |
| basics |
|
|
|
|
| linux |
|
surrey |
Change Directories, edit config files, kill processes, copy/move files, check disk space. |
| bash |
|
tldp.org |
Write a script to periodically sync a directory between servers and schedule it using cron. |
| git |
|
git-scm |
Checkout, branch, commit, push code. |
| Common Tools: jira/jenkins |
|
user-stories |
Write a good jira, assign owner. Kick off a build on a common CD platform. |
|
|
|
|
|
| Programming Language |
|
|
|
Knowledge of 2 different programming paradigms. |
| kdb |
|
kdb-tree |
Write efficient selects for pulling back a subset of data. |
| python |
|
|
Download data from a REST api, calculate average/mean/median for certain metrics. |
| java |
|
book |
Write a java program to count the number of words in a file. |
|
|
|
|
|
| Databases |
|
|
|
Be aware of the major types of database available and when to use each. |
| kdb |
|
kdb-tree |
|
| mysql/postgresql/oracle/ms |
|
|
Know standard SQL. |
|
|
|
|
|
| Software Engineeering |
|
|
peopleware |
How to grow good software. |
| Good Software |
|
|
Properties of good software with examples. |
| Architecture |
|
|
Common Enterprise software patterns. |
| Distributed Systems |
|
Difficulties with distributed systems and common patterns to solve them. |
| Data Processing Pipelines |
|
Common processing Pipeline Patterns |
| Site Reliability Engineering |
|
SRE |
How reliable should software be? |
| Metrics |
|
Ccommon metrics used to measure reliability and when to use each |
| Monitoring |
|
What monitoring systems/tools are available? What are monitoring best practices? |
| Releases |
Accelerate |
|
| Support |
|
Handling outages. Engaging with users. |
| Software Concepts |
Testing |
|
Testing Methods and knowledge of one test framework |
|
|
|
|
|
| User Interfaces |
|
|
dont-think |
What makes a good user interface? |
|
|
|
|
|
| Networking |
|
|
|
How computers connect. Expected latency/bandwidth. |
| TCP/IP |
|
|
ports, switches, racks, data centres, windows. |
| Middleware |
|
|
Messaging midddleware: solace/JMS/kafka/MQ. |
|
|
|
|
|
| Software Development |
|
|
|
|
| agile |
|
|
|
| scrum |
book |
Sprints, iterations, standups, restrospectives, story-time. |
| Lean Development |
lean-startup |
When, why and how to develop lean. |
| Code Reviews |
|
pragma |
Code review best practices. |
Soft Skills
| Skill |
Topic |
Sub-Topic |
Links |
Requirement |
| IT Skills |
|
|
|
|
| excel |
|
|
Create a table with conditional formatting, calculate sum/average of column, use vlookup |
| outlook |
|
|
Filter emails, create meetings. |
|
|
|
|
|
| Communication |
|
|
|
|
| Emails |
|
|
How to write an email to users, team mates, managers, senior management. |
| Meetings |
|
atlassian |
What is a meeting meant to accomplish? How to achieve that. |
| powerpoint |
|
|
Prepare a presentation for management. |
| visio |
|
|
Draw an architectural diagram of your system. |
|
|
|
|
|
| Sales |
|
|
|
|
| Marketing |
|
Traction |
How to get your software used and appreciate by more users. |
| Support |
|
|
|
|
| Networking |
|
|
|
Building a network to get things done. |
|
|
|
|
|
| Management |
|
|
Grove |
|
| Building a Team |
|
Dysfunctions |
|
| One to Ones |
|
|
What makes a good one-to-one |
| Interviews |
|
|
How to evaluate cnadidates effectively. |
| Quality |
|
|
How to ensure quality of product. |
| Organizational Structures |
|
phoenix |
Different structures for management. |
| Project Management |
|
|
|
| Roadmaps |
|
|
| Decision Making |
|
Which approach to decision making to use when. |


