Kdb+ q Database Introduction

kdb/q/kdb+ is both a database (kdb) and a vector language (q). It's used by almost every major financial institution: Goldman Sachs, Morgan Stanley, Merrill Lynch, JP Morgan, NYSE/Euronext, Deutsche Bank...it's probably quicker to say which banks are not using it. It's interesting work and the kdb+ developer salary is good
We will examine the defining characteristics of kdb/q separately, before showing how combined they provide a powerful tool for timeseries analysis that conquered the financial industry.
Contents
- Kdb+ the Database - Column Oriented DB allowing fast timeseries analysis
- q language - fast, interpreted vector based language
- Combined power of kdb+/q - Change how you think!
Kdb+ the Database
Kdb+ is an in-memory column-oriented database based on the concept of ordered lists. In-memory means it primarily stores its data in RAM. This makes it extremely fast with a much simplified database engine but it requires a lot of RAM (Which no longer poses a problem as servers with massive amounts of RAM are now inexpensive). Column oriented database means that each column of data is stored sequentially in memory i.e.:
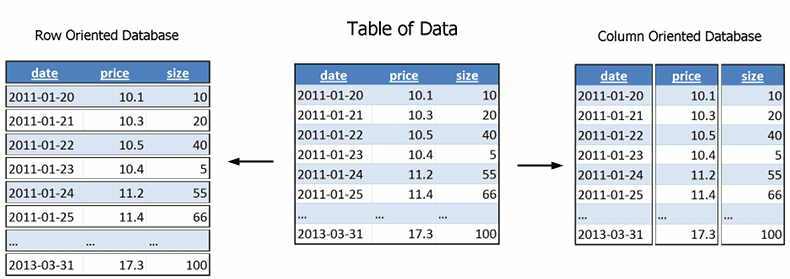
Look at the above image, now imagine which areas need read when you perform a query like "average price" for all dates. In row-oriented databases we have to read over large areas, in column-oriented databases the prices are stored as one sequential region and we can read just that region. Column-oriented databases are therefore extremely quick at aggregate queries (sum, average, min, max, etc.).
Why are most databases row-oriented? I hear you ask. Imagine we want to add one row somewhere in the middle of our data for 2011-02-26, on the row oriented database no problem, column oriented we will have to move almost all the data! Lucky since we mostly deal with time series new data only appends to the end of our table.
Lastly a subtle point is that unlike most standard SQL which is based on set theory, kdb+ is based on vectors of ordered lists. Where standard SQL has struggled with queries like find the top 3 stocks by price, find the bottom 3 by market cap because it has no concept of order, kdb's ordering significantly simplifies many queries. This ordered concept allows kdb+ to provide unique timeseries joins that would be be extremely difficult in other variations of SQL and require the use of slow cursors.
q language
Q is a interpreted vector based dynamically typed language built for speed and expressiveness. It is descended from APL and based upon an earlier language designed by Arthur Whitney called K. To get started you can download a free 32-bit trial version from kx, once you install it and run q.exe your presented with a q) prompt. Since q is interpreted you can enter commands straight into the console there is no waiting for compilation, feedback is instantaneous. Here we can see a user creating a list l at the q console and performing some operations on it:
Notice in the example code above the absence of loops, no for/while/do yet we could easily express adding one array to another. This is because the vector/list is the primary unit of data in kdb+. Operations are intended to be performed and expressed as being on an entire set of data. Dictionaries can be defined using lists, they provide a hashmap datastructure for quick lookups. Tables are constructed from dictionaries and lists. This brevity of data structures is actually one of the attributes that gives q its ability to express concisely what would take many lines in other languages. If we wanted to calculate the standard deviation of a list of numbers we could write a function like so:
Standard Deviation calculation in q
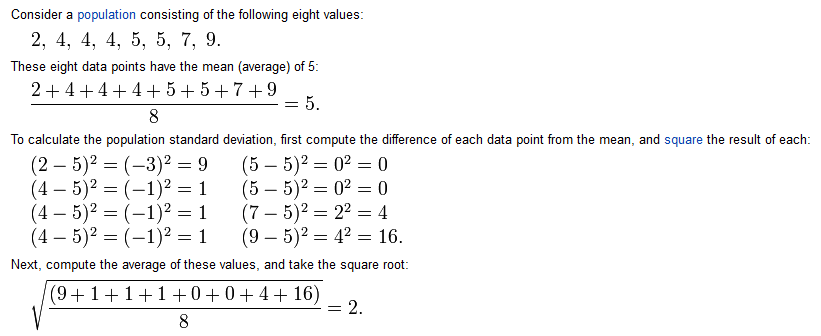
In q we can simply write this as the one line
The curly brackets here hold the body of the function, x is a default parameter name. Consider how many lines of code this function would take in your favourite language. Vector based programming will hinder the ability to express some concepts but for working with large sets of data it is much more concise and expressive than most other languages.
Combined power of kdb+/q
What's beautiful about kdb+ is that since tables are columns of vectors, all the power of the q language can be used as easily on table data as it was on lists.
Where we had sum[l],avg[l],weightedAvg[l1;l2] of lists we can write similar qSQL:
select avg price, sum volume, weightedAvg[time;price] from trade
Want to apply a function to a timeseries, simply place it inline:
select {a:avg x; sqrt avg (x*x)-a*a} price from trade
Once you become more adept at kdb+/q it begins to change your thinking. You start to think of functions and data at a higher level than the function[args], int/double level since you are always working with higher level abstractions, this allows clearer thinking and shorter code. This higher level thinking together with the ability to enter commands for immediate interpretation makes kdb+ the best platform for analysing timeseries data.
This tutorial is a small subsection of one module from our full kdb+ training courses. If you are new to kdb+, you will find our Introductory kdb+ training course the best way to master kdb+.
