
kdb+ Trade Quote Chart
Download Pulse
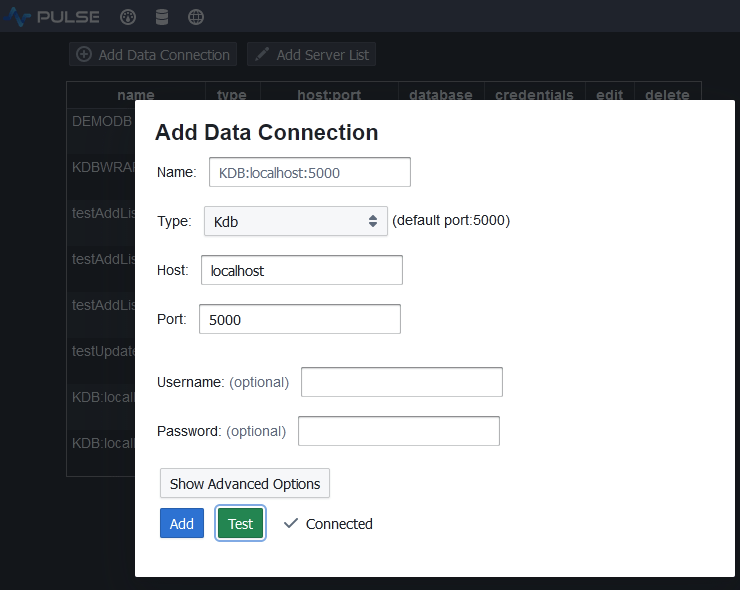
Add kdb+ Server Connection
To add a connection goto Connections->"Add Data Connection" and fill in your details.
You can try clicking test to see if the connection works before adding it.
Populating the Tables
Copy and Paste the below code into the SQL Editor and press "Send Query":
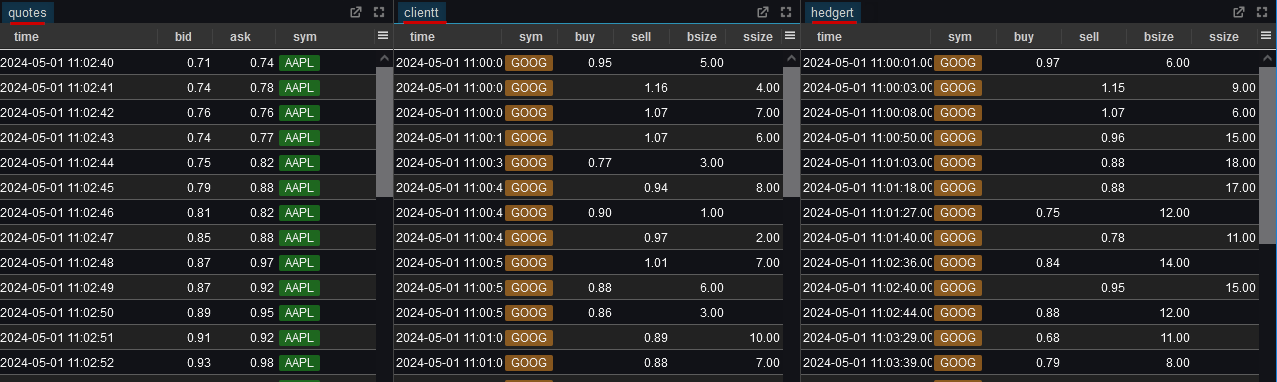
This will create three tables:
quotes- Containing time,bid,ask,sym columns.clientt- Where each row is a Client Trade at a specified time and buy/sell price and size.hedgert- Where each row is a Hedger Trade at a specified time and buy/sell price and size.
The hedger makes infrequent trades to reduce risk positions.
Add and Edit Application
- On the applications listing page, click add
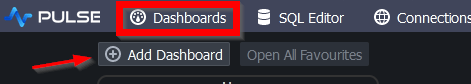
- Click on the newly created application to go into it. Either click on edit or toggle design mode once in the application.

Add Real-Time Quote Graph
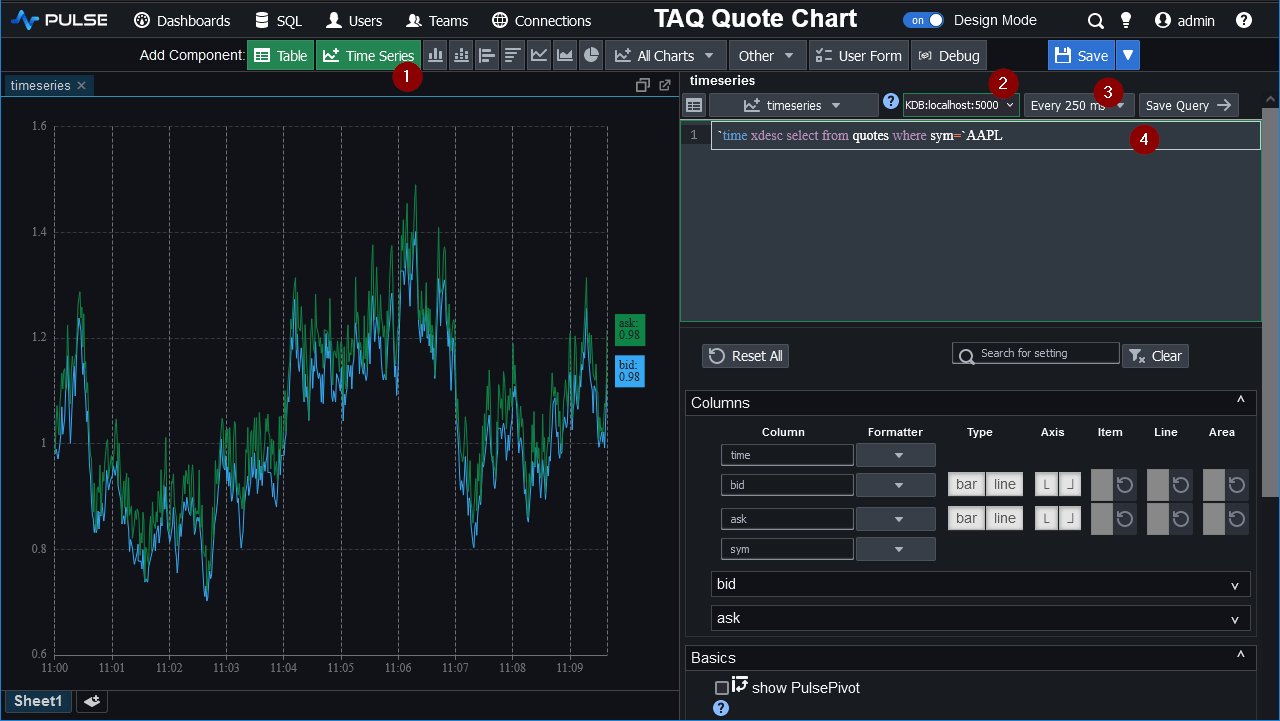
- Click
Time-Seriesto add that component - Make sure your kdb+ data source is selected
- Select the refresh rate.
Every 250ms - Enter the SQL query
`time xdesc select from quotes where sym=`AAPL, click save or press ctrl+E.
Note the xdesc is required as the position of the labels is decided by the order of the data.
Joining Trades To Quotes
Replace the table query with the below:
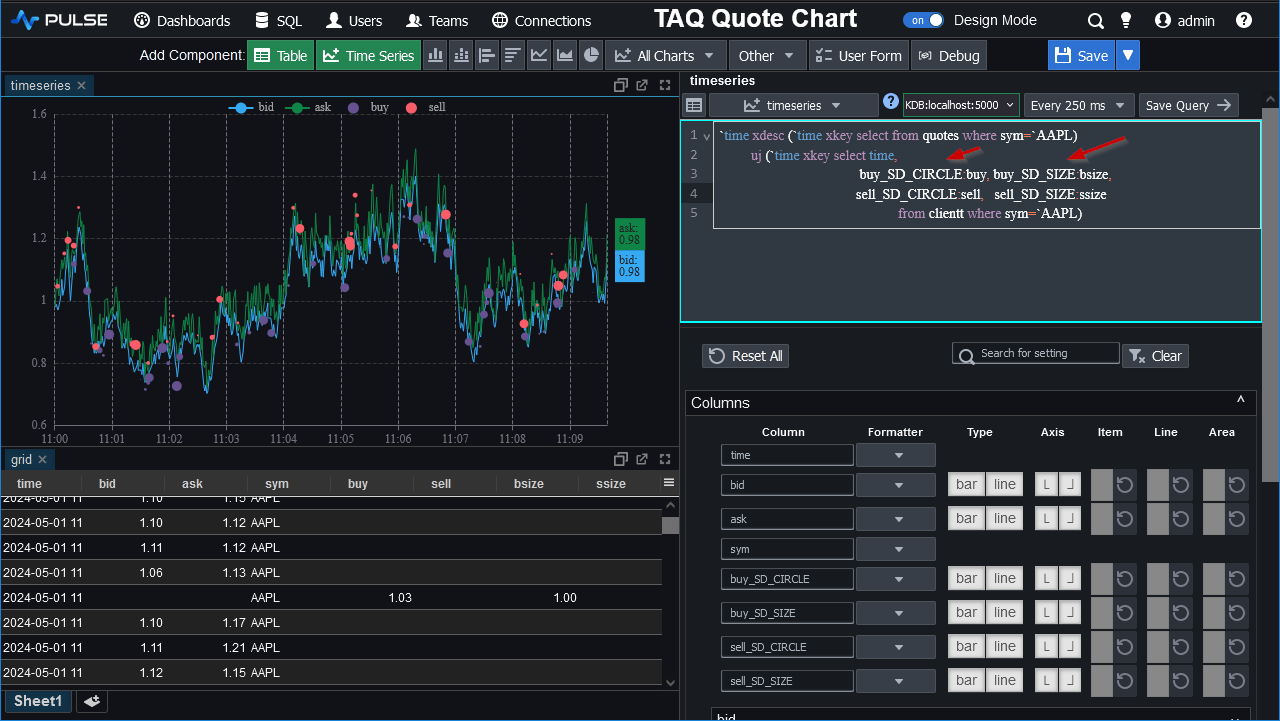
Once you save you should see a chart similar to that shown below. Notice:
- The special naming
buy_SD_CIRCLEmeans render those items as circular points only. - The related column
buy_SD_SIZEcontrols the size of the circles.
This behaviour including additional shapes etc. is documented further in our TAQ chart docs.
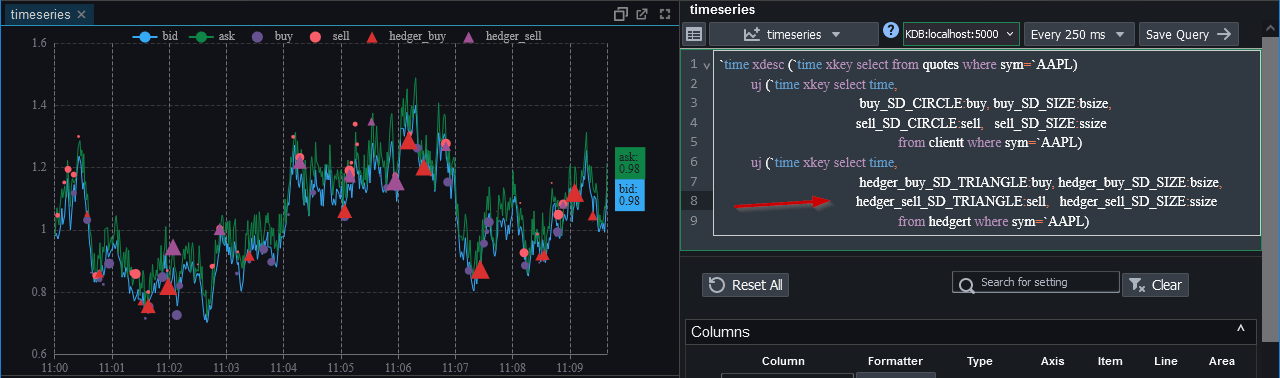
Joining Hedger Trades To Quotes
We can similarly union join the hedgert table to get hedger trades as triangles like so:
Next - Try it yourself
Thanks for watching our demo. Please download Pulse to give it a try for yourself.