QStudio
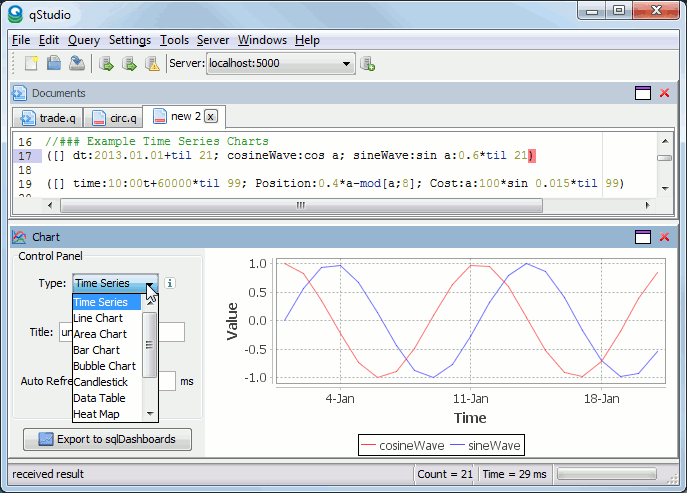
Query kdb+ Servers and Chart Results.
Often I get asked:
First let's create a table t.
To time how long a query takes to run we could use the system t or \t command.
Running a command prefixed with \t causes it to return the time that it took to run in milliseconds.
We can then go one step further and use the \t:n command to run the same query n times and return the total time in milliseconds.
As shown below:
If we want to profile both how much time and how much memory a query takes to run we can use \ts:n.
This returns two values, the time taken in milliseconds and the space required in bytes.
One area that we have used this is as part of the qunit test framework for kdb, we log how much memory and time a test takes to run. The framework also allows specifying the maximum time/memory that a unit test should take.
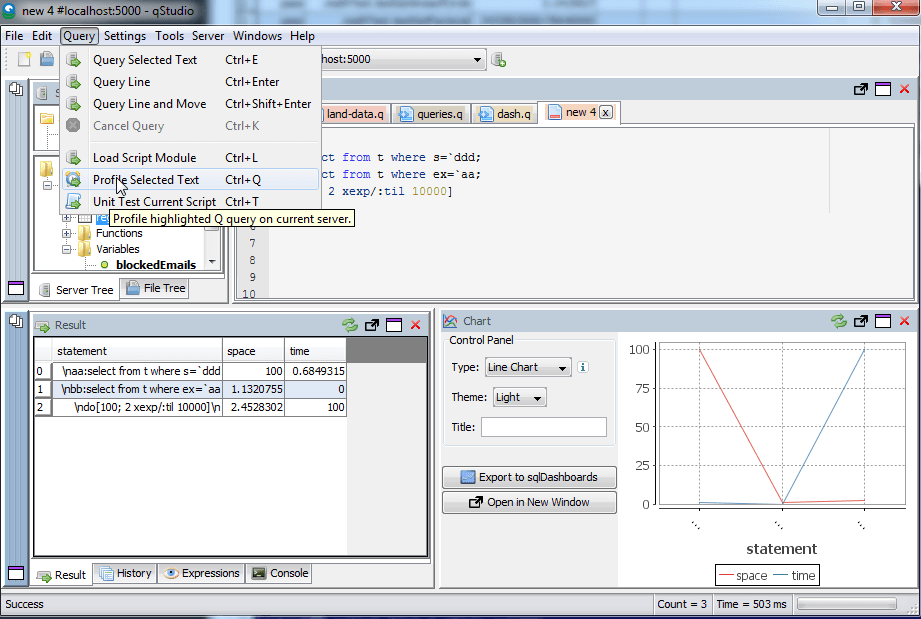
Another interesting idea to try is automatically breaking functions into statements and timing each part, or creating a tool that profiles each line. QStudio provides a basic version of this:
Query kdb+ Servers and Chart Results.